Download
1 / 9
90 likes | 225 Vues
Ch. 20.1 Population Ecology pp.379-382. Population = group of the same species, in the same place, at the same time the place can be defined any way you decide Pop. size = count Pop. density = thickness =. Population #1: 30 people in the gym Population #2: 20 people in Mr. G’s room

E N D
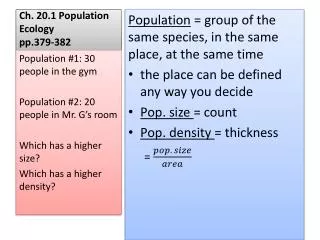
Ch. 20.1 Population Ecologypp.379-382 Population = group of the same species, in the same place, at the same time • the place can be defined any way you decide • Pop. size = count • Pop. density = thickness = Population #1: 30 people in the gym Population #2: 20 people in Mr. G’s room Which has a higher size? Which has a higher density?
Ch. 20.1 Population Ecologypp.379-382 . . . . . . . . . . . . . . . . . . . . . . . . . . . . . . Pop. Size #1 = 30 Pop. Density #1 Pop. Size #2 = 20 Pop. Density #2= ←80 ft→ ←100 ft→ ←30 ft→ ………. ………. ←20 ft→
Ch. 20.1 Population Ecologypp.379-382 . . . . . . . . . . . . . . . . . . . . . . . . . . . . . . Pop. Size #1 = 30 Pop. Density #1 = = = 0.003 Pop. Size #2 = 20 Pop. Density #2= = = .03 ←80 ft→ ←100 ft→ ←30 ft→ ………. ………. ←20 ft→
Ch. 20.1 Population Ecologypp.379-382 Dispersion = spatial distribution of the population • How they are spread out • Clumped • Even • Random Name a population that might be: Clumped: Even: Random: :: ::: . . . . . . . . . . : . : . . : .
Ch. 20.1 Population Ecologypp.379-382 Dispersion = spatial distribution of the population • How they are spread out • Clumped • Even • Random Name a population that might be: Clumped: ducks on a pond Humans in a city Even: Owls in a forest Random: Beetles in a forest :: ::: . . . . . . . . . . : . : . . : .
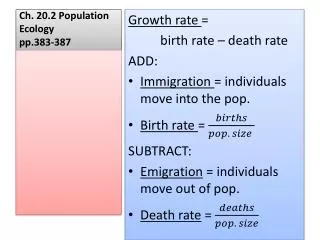
Ch. 20.1 Population Ecologypp.379-382 Population Dynamics = how populations change • Dynamic = changing constantly • Birth rate = births/time • Death rate = deaths/time • Life expectancy = how long the average individual is expected to live Why might the average woman live longer? Is it because they are healthier or the average man lives shorter?
Ch. 20.1 Population Ecologypp.379-382 Age structure = distribution by age of individuals in a population
Ch. 20.1 Population Ecologypp.379-382 Survivorship curve = shows when populations die (how they survivor) Type I: few die early in life, many die late in life (humans, elephants) Type II: die equally throughout life (prey species, mice, squirrels, rabbits…) Type III: many die early, few die late (insects, oysters, turtles)
Ch. 20.1 Population Ecologypp.379-382 OUT: Table 20-1 p. 380 Predict the Land Size of the countries from Largest to smallest. Calculate the population of the U.S. in the year 2000 using the information from the table, if the U.S. has an area of 9,620,000 km2