Understanding Population Density and Growth in Ecology
730 likes | 919 Vues
This article explores the concepts of population density, growth, and community interactions in ecology. It defines population density as the number of individuals of a species per unit area or volume, providing examples like alligators in swamps and bacteria on agar plates. It addresses the limiting factors to population growth and carries capacity, describing how different species interact through competition and predation. Additionally, it discusses human population growth and ecological relationships, highlighting the implications for biodiversity.

Understanding Population Density and Growth in Ecology
E N D
Presentation Transcript
35.1 Population Density Population density is the number of individuals of a particular species per unit area or volume. Examples: • 35 alligators per square km of a swamp • 1,000,456 bacteria per cm2of an agar plate • 120 earthworms m2of soil
Population density problems On rare occasions you can count all the individuals in a population, such as the number of beech trees in a forest measuring 50 square kilometers (km2). Population density = Individuals = 1000 trees = 20 trees Unit area 50 km2 km2 • Population density is a helpful measurement for comparing populations in different locations.
35.2 There are limits to a population’s growth • Exponential growth: growth of a population that multiplies by constant factor • Limiting factor:condition that restricts a population’s growth, such as space, disease and food availability. • Carrying capacity: number of organisms in a population that an environment can maintain.
Exponential Growth Figure 35-5This table shows how many bacteria are in a population that doubles every 20 minutes. The graph is another way to show the same data.
Figure 35-6 CARRYING CAPACITY • Figure 35-6Before the early 1900s, hunting kept this population of fur seals below the carrying capacity of the environment. Then, after hunting was reduced, the population grew almost exponentially for two decades. The population began to level off as it reached the carrying capacity.
Changes in Population Size • Growth factors (increase in pop.) • Immigration: individuals moving into a population • Births • Shrinking factors (decrease in pop.) • Emigration: individuals moving out of a population • Deaths
Exponential Growth= J curve Early phase of growth High availability of resources Little competition Little predation
Logistic Growth= S curverepresent Carrying capacity • Limits on growth appear • Competition for resources • Predation • Parasitism • Illness
35.3 Human Population Growth The human population is now growing at a rate of about: 3 people/second or 260 thousand/day or 1.8 million per week or 93 million/year Earth’s Carrying Capacity about 50 Billion
Human Population Growth Are humans in exponential or logistic growth?
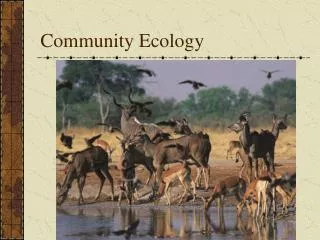
35.4 Interactions in Communities Competition Between Species An elephant, cannot survive without other organisms. • elephant herd of elephants (population) an elephant’s community • An elephant’s community = gazelles, giraffes, birds, ants, beetles, fungi, bacteria, grasses, trees Members of a population compete for limited resources in the environment. • -Competition within a single species limits the growth of the population. Interspecific competition: when two or more species rely on the same limited resource (competition between 2 different species) example:during times of drought in an African savanna community, grasses may be in short supply, and competition becomes intense.
Competitive Exclusion Competitive exclusion: One species succeeding over another, when the growth of both species is limited by the same resource. Figure 35-14Two similar species may each thrive in separate locations, but one may exclude the other when they are placed together. The results of an experiment with two Paramecium species demonstrate this principle of competitive exclusion.
NICHE Niche: a unique living arrangement of an organism defined by its living place (habitat), its food sources, the time of day it is most active, and other factors • The local loss of a species is likely to occur if 2 species have niches that are very similar • niches are rarely identical. • Example: one lizard in a tropical forest feeds on insects in low shrubs, while a similar lizard may eat insects high in the trees.
Predation Predation: an interaction in which one organism eats another. • The lion attacks and eats an injured zebra or an egret catches and eats a fish. Predator: the organism that kills/ eats the prey. Prey: the organism that gets eaten. • eating and avoiding being eaten are important to survival, • many effective adaptations have evolved in both predators and prey.
Predator Adaptations • fast and agile • camouflage • teaming up in packs acute senses • claws, teeth, fangs, and stingers Ex. Rattlesnakes locate their prey with heat-sensing organs located between each eye and nostril.
Prey Adaptations • retreat to safe locations • flee from predators • camouflage to hide • "warning coloration" is a caution to predators. • mimicry -look like organisms that are poisonus or dangerous. • Plants have poisonous chemicals and structures such as spines and thorns.
Symbiotic Relationships Symbiotic relationship is a close interaction between species in which one of the species lives in or on the other. • 3 main types of symbiotic relationships: parasitism, mutualism, and commensalism. 1.) Parasitism is a relationship in which the parasite obtains its food at the expense of the host. • Usually the parasite is smaller than the host. (blood-sucking mosquitoes and tapeworms)
Mutualism: both organisms benefit from the symbiotic relationship. • Your large intestine is inhabited by millions of bacteria. • The bacteria benefit by having a warm, moist home and food. • Intestinal bacteria produce vitamin K. Vitamin K is essential for blood clotting. • Both you and the bacteria benefit from this relationship.
Mutualism Pair of Coleman Shrimp on fire urchin Manta Ray with Remoras
Commensalism is a relationship in which one organism benefits, while the other organism is neither harmed nor helped significantly. Example: A spider crab may place seaweed on its back. The crab benefits by being camouflaged from its predators. The seaweed is not affected. • commensalism in nature is rare, since most interactions harm one species (parasitism) or help both species (mutualism) to some degree.
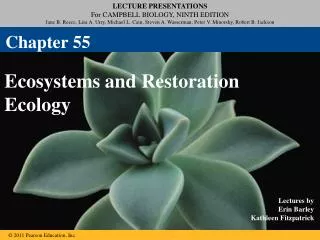
Ecological Succession Ecological succession. Series of changes in the species of a community, often followed by a disturbance. Primary Succession-process by which a community arises in a lifeless area that has no soil barren ground lichen/mosses grass shrubs pine trees hardwood trees Examples: • Forest devastated by a fire, or volcano • new islands created by erupting volcanoes • bare rock left behind a retreating glacier.
Primary Succession Lichens and mosses Grasses And small shrubs Large shrubs and small trees Large trees The establishment and development of an ecosystem in an area that was previously uninhabited
Surtsey: A Case Study The island of Surtsey formed by volcanic eruption off of the coast of Iceland during the period from 1963 - 1967
Secondary Succession Secondary succession when a disturbance damages an existing community but leaves the soil intact • Grasses shrubs trees similar to the original forest. Example: when a forested area is cleared for farming and then abandoned.
Secondary Succession Fireweed Sequoia seedling The recovery of a damaged ecosystem in an area where the soil was left intact
Case Study: Yellowstone National Park 1988 – Devastating forest fires burn much of Yellowstone National Park. Photo: National Parks Service
Yellowstone National Park 1988 – Park map showing areas (1.6 million acres) burned by the series of fires.
Yellowstone National Park 1988 fires – The immediate aftermath. Photo: National Parks Service
Yellowstone National Park One year after the fires Note the appearance of fireweed Photo: National Parks Service
Yellowstone National Park Ten years after the fires (1998) Photo: National Parks Service
Yellowstone National Park Twenty years after the fires (2008)
Case Study - Chernobyl In April, 1986, a nuclear power plant in the former USSR experienced a core meltdown and a catastrophic release of radioactivity into the environment.
Chernobyl Surrounding towns and villages had to be immediately, permanently abandoned.
Chernobyl – Twenty Years Later Pripyat town square.