Going Deeper Into Analysis
380 likes | 524 Vues
Join our interactive webinar, "Advanced Data Training," where we explore the complexities of pattern and trend analysis, emphasizing misuse and caution. Discover task analysis from an instructional systems perspective, identify underlying systems, and minimize unintended consequences. Learn effective data comprehension skills, distinction between data types, and the importance of data literacy in interpretation. Engage in guided discussions to enhance your understanding of how to apply data insightfully in instructional decision-making. This session promises to elevate your analytical capabilities!

Going Deeper Into Analysis
E N D
Presentation Transcript
Going Deeper Into Analysis Module 2 Advanced Data Training
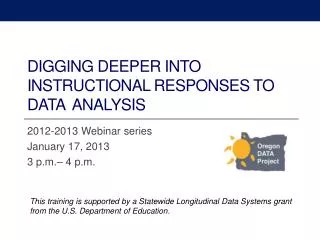
Today’s Content • Misuse and cautions for pattern and trend analysis, • Task analysis from an instructional systems’ perspective • Identify underlying systems • short term fixes and minimizing unintended consequences • system structures or underlying causal drivers of behaviors that may lead to long term change.
Webinar Format Expect interaction! Guided discussion and cross-site dialogue are planned at critical points in the session.
Data Comprehension:What do the data say? • Comprehending data involves making sense of data in tables, charts, text, figures, etc. • Involves reasoning about multiple data points and variables. • Finding patterns requires first understanding what the available data say about students, teachers, schools or districts at multiple points in time. United States Department of Education, Office of Planning, Evaluation and Policy Development. (2010). Teachers’ ability to use data to inform instruction: Challenges and supports. Retrieved from http://www2.ed.gov/rschstat/eval/data-to-inform-instruction/report.doc
Findings on Data Comprehension Strong Areas Weak Areas Evaluating results when additional calculations were required. Distinguishing histograms and bar charts. Distinguishing between cross-sectional and longitudinal data and what each says about students or groups of students. • Comparing a table, graph or figure to a written description of the data.
Strength:Describing single point in time charts. Descriptions: 47.9% of students in Oregon met standards in 2009-10. Roughly a quarter of students in Oregon exceeded standards. The percentages of students who nearly met the standard or were classified as ‘Low’ were nearly equal (~ 12%). 1.2% 12.5% 26.2% 12.2% 47.9%
More difficult How do percentages meeting and exceeding compare in reading and math for 200910? Math Reading 1.5% 1.2% 12.5% 7.7% 26.2% 27.5% 13.7% 12.2% 47.9% 49.6%
Both charts summarize math performance for 2009-10 Bar Chart Histogram
Cross-sectional versus Longitudinalfor Grade 6 Cross-sectional: Who is included in Grade 6 math chart? Longitudinal: Who is included in Grade 6 math chart? 2005 2006 2007 2008 2009 2010 2007 2008 2009 2010
Math All Grades Longitudinal and cross-sectional trends can be tricky • What are some considerations to keep in mind when looking at percent meeting trends for math as compared to reading over time? 2005 2006 2007 2008 2009 2010 Reading All Grades 2005 2006 2007 2008 2009 2010
Changes in cut scores and other definitions limit comparability across years and among subject areas.Read the Notes!
Reflection/Interaction Activity What was important about this information for your role and setting?
Data Interpretation:Not just what does it say, but what does it mean? Data literacy skills are needed to draw reasonable inferences.
Data Literacy Skills • Interpreting mean scores/understanding importance of examining underlying score distribution. • Discerning the impact of outliers. • Understanding limits of generalizability of data. • Conceptual understanding of measurement error and its importance in interpreting scores.
Findings on Data Interpretation Strong Areas Weak Areas Did not consider the underlying score distribution when analyzing averages for grade or school level. Did not reflect an understanding of measurement error as an integral part of testing and measurement. • Considered underlying individual scores and outliers in classroom level data. • Understood impact of group size on the generalizability of the meaning of the data. • Conceptualized measurement error as fluctuating scores due to ‘off days’.
Areas of Strength Student roster of performance • Given a roster of students, teachers were able to interpret performance in general and possible impact of outliers. • Teachers interpreted appropriate generalizability of information for small groups when presented with classroom results.
Areas of Concern Grade 5 Math 2009-10 Considerations What is total range of performance? What can’t you see when looking only at the mean? How might you infer the differences in Grade 5 math means if you didn’t use the margin of error provided?
Reflection/Interaction Activity Formulate questions that guide the interpretation of these data
What questions would you use to guide discussion of this report? 225 231 235 District School 1
Data use for decisions involves: • Use and limitations of strand/subscores and item-level data. • Moving from interpretation to differentiated instructional plans. • Synthesis of data sources to inform classroom practices.
Findings on Data Use in Decision Making Strong Areas • Most teachers expressed value for examining more detailed information about student performance. • Some teachers expressed a desire to link student scores on items to students’ thinking in answering specific items.
Findings on Data Use in Decision Making Study Limitations • Did not examine teachers’ understanding of the types of assessments that are appropriate for interpreting more detailed information. • Did not examine whether teachers understood the limitations of subscores.
Differentiating Instruction based on Data Strong Areas Weak Areas More likely to think about differentiating instruction when given individual student level data with scores for specific subskills. When presented with group mean scores for general math performance only 50% expressed need to see more detailed information on students in order to differentiate instruction. • Provided strategies for differentiating instruction either through small group or individual interventions. • Understood need for flexible grouping and differentiated strategies for students based on strengths and weaknesses within a subskill.
Findings on Synthesizing Data Sources Strong Areas Weak Areas When faced with multiple data sources that support different inferences, teachers didn’t know where to go next. Teachers tended to relate the presented student data to real students in their classroom and to make decisions based on their prior experiences with those real students rather than basing decisions on the data. • Half of teachers questioned indicated multiple sources of data were important for making instructional decisions (state test & classroom assessment).
Reflection/Interaction Activity What considerations would you have in planning data team discussions about instructional strategies based on this information?
Overarching Finding:Together Everyone Achieves More • More data literacy skills evident, and valid conclusions and inferences are more likely to result from groups of teachers working together to comprehend and interpret data than individual teachers. • Group or team discussions/interactions over data tend to support application of data to improving instruction.
From data analysis to instructional systems analysis Data use happens within larger instructional systems in a school.
Meaningful change involves understanding impact of adult actions • Instructional systems within a school are interdependent. • Use student data to analyze outcomes of adult actions in the system. • Changes in the instructional system may have intended and unintended results. • Anticipate or hypothesize impact of changes to the system.
Impact of adult actions: quick fixes Identify students on bubble of meeting standards Data Team Data Use Focus instruction on needs of bubble students. Student Achievement Results Over Time Desired Percent Percent Meeting Time Unintended Consequences: In the long run students needs at the extremes of performance go unmet and overall school performance declines after a short period of improvement.
Avoiding Pitfalls of Quick Fixes • What could adults do to minimize unintended consequences? • Do you collect data on what adults do in response to student data? • Percent of instructional time spent on high priority grade level content? • Percent of interventions aligned to grade level goals? • Elapsed time between data collection and data use? • Audit of data team meeting time focused on student data and student needsrather than adult needs?
Student Performance Limits to Success:Scheduling Example Effort Constraint Time Limiting Action Staff chose to offer drop-in tutoring during open campus lunch for students rather than revise schedule to provide a dedicated time period for intervention and enrichment. Low student performance indicates need for additional help. Teachers’ efforts tutoring a few students
Reinforcing Wrong Focus Opposes B Supports A A B Time spent on general instructional strategies (A) Instead of strategies aligned to identified needs (B) Success with some students for little effort. Success for more students, but greater initial effort. Effort for implementing general strategies Effort for implementing targeted/aligned strategies
How to break the cycle • Action research within the instructional system. • Plan changes in system based on needs identified through data analysis. • Hypothesize desired outcomes from planned change. • Hypothesize potential unintended consequences. • Determine how you will know the change or changes are implemented. • Determine how you will measure the outcome of the changes.
Reflection/Interaction Activity How could you use this information to break undesirable cycles in your school(s)?
Reflective Teacher Taxonomy • Use the taxonomy to become more aware of connection between adult action and student impact. • Use for both positive and negative outcomes • e.g. Analyzing—What actions led to desired response from students? • What actions didn’t have the intended effect on students? Peter Pappas http://www.peterpappas.com/2010/01/reflective-teacher-taxonomy-reflection.html
Summary Slide • Comprehending, interpreting and using data • Be aware of general strengths and weaknesses in data analysis skills. • Data team discussions are important to improving data analysis skills! More minds are better than one! • Look at how team decisions and actions impact the larger instructional system. • Collect data on adult actions—implementation data. • Develop reflective practices to improve decision-making and outcomes.
Next Steps: Blog Assignment • Select a question from below and provide a reflection on the blog based on your answer. • What fixes have you used that have resulted in unintended consequences? • What structures may be limiting the success of your strategies? • What less desired actions are getting reinforced at the expense of more desired actions?