Download
1 / 48
480 likes | 640 Vues
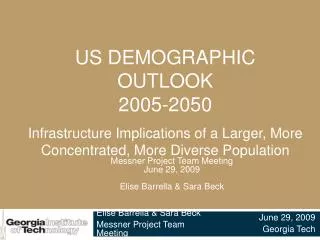
US Demographic Outlook 2005-2050. Messner Project Team Meeting June 29, 2009 Elise Barrella & Sara Beck. Elise Barrella & Sara Beck Messner Project Team Meeting. Infrastructure Implications of a Larger, More Concentrated, More Diverse Population. June 29, 2009 Georgia Tech. Outline.

E N D
US Demographic Outlook 2005-2050 Messner Project Team Meeting June 29, 2009 Elise Barrella & Sara Beck Elise Barrella & Sara Beck Messner Project Team Meeting Infrastructure Implications of a Larger, More Concentrated, More Diverse Population June 29, 2009 Georgia Tech
Outline • US Population Projections • Implications of New Demographics • Spatial distribution of population • New settlement patterns • MegaRegions • Infrastructure Projections • Transportation • Water Resources • Wastewater • Planning Implications
Population Pyramid Projections 2010 2050
13% 16% 19% 20% 20% By midcentury, the nation will be older… Source: United States Census Bureau: 2008 National Population Projection Tables
… and more racially and ethnically diverse… Source: United States Census Bureau: 2008 National Population Projection Tables
Data from NHTS 2001. http://nhts.ornl.gov/briefs/Immigrant%20Travel.pdf • New Immigrant is defined as foreign-born person living in the US for less than 3 years
Summary of Population Changes • Grow from 296M to 438M, an increase of 142M (48%) • 82% of growth due to immigrants and their US-born offspring • Nearly 1 in 5 Americans will be foreign-born vs. 1 in 8 in 2005 • Non-Hispanic Whites will become a minority • Hispanics will triple in number, increasing share to 29% of population • Blacks will remain 13% of the population; Asians will increase to 9% from 5% • Elderly population will more than double • Gap between the number of working-age people and dependents (children and seniors) will widen as boomers age • Pew Research Center, February 2008, US Population Projections: 2005-2050
Implications of Aging Population • Percent of older Americans who continue to drive is growing, especially older women • Safety implications • Air quality concerns (older cars) • Dependence on private car increasing, on transit decreasing • Make 22% less trips than those <65, but mostly non-work trips • Important subsets are less likely to have car access • Special transit services often not available or inadequate • NHTS, March 2009, Older Americans: Safety Implications • Brookings Institution, 2003, The Mobility Needs of Older Americans: Implications for Transportation Reauthorization
Affordable housing • provision and maintenance of housing and location efficiency • property values and tax rates • Older adults, along with other low- or fixed-income persons, are most susceptible to rising energy, housing, and transportation costs
Implications of More Diverse Population • Elderly Hispanic or black persons are more likely to require assistance due to medical conditions • Also less likely to be licensed • Rely more on family members • Greater demand for public transportation • Need for bilingual or multilingual signage • More housing options needed for larger size and composition of families
Where will all the people go? • From 2007-2008, only 12% of population changed residences • Why move? Economic opportunity • Why stay? Family and social network • Differences between movers and stayers? Geography and education • Why fewer moves? Aging population and more two-career households • Economic downturn may have also contributed • Pew Research Center, December 2008, Who Moves? Who Stays Put? Where’s Home?
New immigrants will be concentrated in certain areas (West and Northeast) • Stress on existing aging infrastructure • Demands for new infrastructure (housing, transportation, etc.) • Location of first entry has shifted to suburbs • Elderly also more likely to be located in the suburbs • Often fewer transportation options in suburban locations
Aging suburbs due in part to “age-in-place” phenomenon • Brookings Institution, 2003, The Mobility Needs of Older Americans: Implications for Transportation Reauthorization
Suburban havens (Northeast) and Suburban Growth Centers (Sunbelt) • Brookings Institution, 2003, The Mobility Needs of Older Americans: Implications for Transportation Reauthorization
Population Change Among States • Where are people moving to? • Raleigh, NC • Austin, TX* • Charlotte, NC* • Phoenix, AZ • Dallas, TX* • San Antonio, TX • Houston, TX • New Orleans, LA • Atlanta, GA • Denver, CO* Data from 2008 Census released in March ’09 *Corresponds with data from American Moving and Storage Association • Pew Research Center, March 2009, Magnet or Sticky? A State-by-State Typology
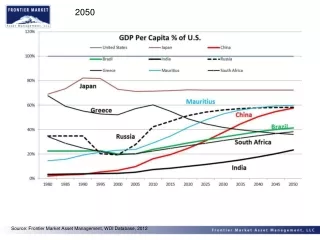
2008 2030
Climate Change & Migration 1 meter rise in sea level Animation of sea level rise in Northeast: http://www.geo.arizona.edu/dgesl/research/other/climate_change_and_sea_level/sea_level_rise/northeast/slr_usane_a.htm
MegaRegions Framework • Between 2005 and 2050, more than half of the nation’s population growth, and perhaps as much as two-thirds of its economic growth, will occur in several “MegaRegions.” • These regions are characterized as networks of metropolitan centers and their surrounding areas that have existing environmental, economic and infrastructure relationships. The traits of a megaregion also include a shared sense of identity, particularly stemming from economic and social interactions. • They often cross county and state lines and are linked by transportation and communication networks. CQGRD, Background Document for the MegaRegions and Transportation Symposium held on June 20, 2008
RPA’s MegaRegions (2006) Background Document for the MegaRegions and Transportation Symposium held on June 20, 2008
MegaPolitans (2005) Background Document for the MegaRegions and Transportation Symposium held on June 20, 2008
Delineating MegaRegions (CQGRD) Metro Regions: Combinations of core counties and their areas of influences Functional Regions: Clusters of Metro Regions based on functional relationships Megaregions: Geographically contiguous and close Functional Regions
Density of trade volumes with Canada and Mexico (2035) Density of trade volumes with overseas countries (2035) Source: FHWA Freight Analysis Framework (2006)
Interstate Bottlenecks (National Surface Transportation Policy and Revenue Study Commission, 2007)
Proposed High Speed Rail Corridors (FRA, 2005)
Planning Challenges for MegaRegions • Defining MegaRegions based on environmental, economic, cultural linkages • Developing institutions for integrated planning across functions at megaregional scale • Continually changing and growing rapidly, so planning requires flexibility • Funding for projects that cross jurisdictional boundaries • Different issues in different MegaRegions • Regional Plan Association, America 2050 Project, The Healdsburg Research Seminar on MegaRegions
Infrastructure-Specific Projections – Water Systems In 10 years, 35 states will be facing water shortages. In 2009, 8% of water systems serve 81% of the population. (source: ASCE Infrastructure Report Card)
Infrastructure-Specific Projections – Water Pipes Many water and wastewater pipes are reaching the end of their design lives source: EPA Infrastructure Gap Analysis Report, 2002
Infrastructure-Specific Projections - Bridges - The average bridge is 43 years old - 12% are structurally deficient • limited structural capacity - 15% are functionally obsolete • can’t accommodate current traffic volumes, vehicle sizes and weights source: ASCE Infrastructure Report Card
Infrastructure-Specific Projections - Roads Miles of roads of federal-aid urbanized areas Source: CQGRD from Miles and daily vehicle-miles of travel, FHWA (2006)
Infrastructure-Specific Projections - Roads Share of the proposed mileage of SHR (%) Source: Schwieterman & Scheidt (2007), Survey of Current High-Speed Rail Planning Efforts in the United States, Transportation Research Record, Journal of the Transportation Research Board, No. 1995. Railways 2007. 27-34.
Planning Considerations • Longer-term planning to begin preparing for demographic changes • Travel forecasting based on mean indicators can mask needs of changing population • Dealing with uncertainty • Infrastructure planning and funding at multiple scales, including the MegaRegion • Focus on jobs/housing/recreation balance in suburban locations OR making inner cities more attractive to families
Carpooling Driving Alone Public Transportation 2007 Transportation Data
Median Household Income Employment/Population Ratio % Below Poverty Line 2007 Income Data
B. DATA & METHODOLOGIES 1. Data (1): Metro Regions CENTER FOR QUALITY GROWTH AND REGIONAL DEVELOPMENT
1. Data (2): Functional Regions & Megaregions DATA & METHODOLOGIES CENTER FOR QUALITY GROWTH AND REGIONAL DEVELOPMENT