Download

1 / 32
320 likes | 497 Vues
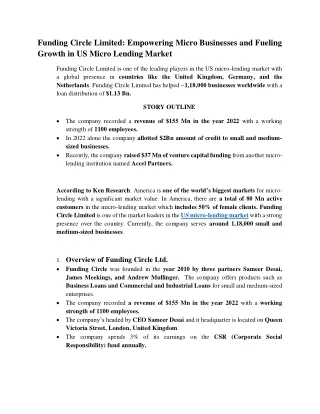
US Macroeconomic Outlook. Presentation Prepared for Catalyst Corporate Federal Credit Union Irving, Texas October 7 th , 2014. Federal Funds [effective] Rate. % p.a. Real Gross Domestic Product. % Change - Annual Rate SAAR, Bil.Chn.2009$. 20. 20. 15. 16. 10. 12. 5. 8. 0. 4. -5.

E N D
US Macroeconomic Outlook Presentation Prepared for Catalyst Corporate Federal Credit Union Irving, Texas October 7th, 2014
Federal Funds [effective] Rate % p.a. Real Gross Domestic Product % Change - Annual Rate SAAR, Bil.Chn.2009$ 20 20 15 16 10 12 5 8 0 4 -5 0 -10 45 50 55 60 65 70 75 80 85 90 95 00 05 10 Sources: FRB, BEA /Haver FFED vs GDP • Federal Funds [effective] Rate • % p.a. • Real Gross Domestic Product • % Change - Annual Rate SAAR, Bil.Chn.2009$ • FFED vs GDP.EMF (USECON) FFED / GDPH 4409-11408
Federal Funds [effective] Rate % p.a. Real Gross Domestic Product % Change - Annual Rate SAAR, Bil.Chn.2009$ 20 10 16 5 12 0 8 -5 4 0 -10 80 85 90 95 00 05 10 Sources: FRB, BEA /Haver FFED vs. GDP, 80-2014 • Federal Funds [effective] Rate • % p.a. • Real Gross Domestic Product • % Change - Annual Rate SAAR, Bil.Chn.2009$ • FFED vs. GDP, 80-2014.EMF (USECON) FFED / GDPH 7909-11408
Real Residential Inv. vs GDP • Real Private Residential Fixed Investment • SAAR, Bil.Chn.2009$ • Real Gross Domestic Product • % Change - Annual Rate SAAR, Bil.Chn.2009$ • Real Residential Inv. vs GDP.EMF (USECON) FRH / GDPH 893-1142
Real PCE vs GDP • Real Personal Consumption Expenditures • % Change - Year to Year SAAR, Bil.Chn.2009$ • Real Gross Domestic Product • % Change - Annual Rate SAAR, Bil.Chn.2009$ • Real PCE vs GDP.EMF (USECON) CH / GDPH 893-1142
DPI vs PCE • Disposable Personal Income • % Change - Year to Year SAAR, Bil.$ • Personal Consumption Expenditures • % Change - Year to Year SAAR, Bil.$ • DPI vs PCE.EMF (USECON) YPDM / CBM 8908-11407
Personal Savings Rate • Personal Saving Rate • SAAR, % • Personal Savings Rate.EMF (USECON) YPSVRM 7908-11407
Participation Rate vs Unemp Rate • Civilian Participation Rate: 16 yr + • SA, % • Civilian Unemployment Rate: 16 yr + • SA, % • Participation Rate vs Unemp Rate.EMF (USECON) LP / LR 7909-11408
Civilian Participation Rate: Men, 20 Years and Over SA, % Civilian Unemployment Rate: 16 yr + SA, % 90 12 10 85 8 80 6 75 4 70 2 80 85 90 95 00 05 10 Source: Bureau of Labor Statistics /Haver Analytics Men over 20 PR vs Unemp • Civilian Participation Rate: Men, 20 Years and Over • SA, % • Civilian Unemployment Rate: 16 yr + • SA, % • Men over 20 PR vs Unemp.EMF (USECON) LPMT20 / LR 7909-11408
Civilian Participation Rate: Women, 20 Years and Over SA, % Civilian Unemployment Rate: 16 yr + SA, % 67.5 12 60.0 10 52.5 8 45.0 6 37.5 4 30.0 2 80 85 90 95 00 05 10 Source: Bureau of Labor Statistics /Haver Analytics Women over 20 vs Unemp • Civilian Participation Rate: Women, 20 Years and Over • SA, % • Civilian Unemployment Rate: 16 yr + • SA, % • Women over 20 vs Unemp.EMF (USECON) LPWT20 / LR 7909-11408
16-19 yrs PR vs Unemp • Civilian Participation Rate: 16-19 Years • SA, % • Civilian Unemployment Rate: 16 yr + • SA, % • 16-19 yrs PR vs Unemp.EMF (USECON) LP16 / LR 7909-11408
Newly Unemployed Entrants • Civilians Unemployed: New Entrants • SA, Thous. • Newly Unemployed Entrants.EMF (USECON) LUNE 5909-11408
Change in Total Nonfarm Employment SA, Thous Civilian Unemployment Rate: 16 yr + SA, % 800 10 400 8 0 6 -400 4 -800 -1,200 2 90 95 00 05 10 Source: Bureau of Labor Statistics /Haver Analytics Nonfarms vs Unemp rate • Change in Total Nonfarm Employment • SA, Thous • Civilian Unemployment Rate: 16 yr + • SA, % • Nonfarms vs Unemp rate.EMF (USECON) LANAGRD / LR 8909-11408
Construction NFP • Change in Construction Employment • SA, Thous • Construction NFP.EMF (USECON) LACONSD 8909-11408
Manufacturing NFP • Change in Manufacturing Employment • SA, Thous • Manufacturing NFP.EMF (USECON) LAMANUD 8909-11408
Service Sector NFP • Change in Private Service-Providing Employment • SA, Thous • Service Sector NFP.EMF (USECON) LAPSRVD 8909-11408
Oil and Gas NFP • All Employees: Oil & Gas Extraction • SA, Thous • Oil and Gas NFP.EMF (USECON) LAB1A 6909-11408
All Employees: Support Activities For Mining SA, Thous 450 450 375 375 300 300 225 225 150 150 75 75 70 75 80 85 90 95 00 05 10 Source: Bureau of Labor Statistics /Haver Analytics Support for O&G NFP • All Employees: Support Activities For Mining • SA, Thous • Support for O&G NFP.EMF (USECON) LAB3A 6909-11408
Total Construction payrolls • All Employees: Construction • SA, Thous • Total Construction payrolls.EMF (USECON) LACONSA 6909-11408
Total Manufacturing Payrolls • All Employees: Manufacturing • SA, Thous • Total Manufacturing Payrolls.EMF (USECON) LAMANUA 6909-11408
Total Service Payrolls • All Employees: Private Service-providing Industries • SA, Thous • Total Service Payrolls.EMF (USECON) LAPSRVA 5909-11408
Avg Weekly Earnings: Prod & Nonsupervisory: Total Private Industries % Change - Year to Year SA, $/Week 10 10 8 8 6 6 4 4 2 2 0 0 80 85 90 95 00 05 10 Source: Bureau of Labor Statistics /Haver Analytics Weekly Earnings Growth • Avg Weekly Earnings: Prod & Nonsupervisory: Total Private Industries • % Change - Year to Year SA, $/Week • Weekly Earnings Growth.EMF (USECON) LKPRIVA 7909-11408
CPI, 1980-Now • CPI-U: All Items, 1982-84=100 • Y/Y %Change • CPI, 1980-Now.EMF (USECON) PCUY 7908-11407
3-Month Treasury Bills, Secondary Market % p.a. CPI-U: All Items, 1982-84=100 Y/Y %Change 22.5 22.5 15.0 15.0 7.5 7.5 0.0 0.0 -7.5 -7.5 -15.0 -15.0 30 40 50 60 70 80 90 00 10 Sources: FRB, BLS /Haver 3moTBill vs CPI • 3-Month Treasury Bills, Secondary Market • % p.a. • CPI-U: All Items, 1982-84=100 • Y/Y %Change • 3moTBill vs CPI.EMF (USECON) FTBS3 / PCUY 2409-11408
New Single Family Home Sales vs Affordability • New 1-Family Houses Sold: United States • SAAR, Thous • Composite Housing Affordability Index • Median Inc=Qualifying Inc=100 • New Single Family Home Sales vs Affordability.EMF (USECON) HN1US / HACI 4908-11407
NAR Total Existing Home Sales, United States SAAR, Thous Composite Housing Affordability Index Median Inc=Qualifying Inc=100 7,500 240 6,750 200 6,000 160 5,250 120 4,500 80 3,750 3,000 40 50 55 60 65 70 75 80 85 90 95 00 05 10 Source: National Association of Realtors /Haver Analytics Existing Home Sales vs Affordability • NAR Total Existing Home Sales, United States • SAAR, Thous • Composite Housing Affordability Index • Median Inc=Qualifying Inc=100 • Existing Home Sales vs Affordability.EMF (USECON) HXTUS / HACI 4908-11407
NAR Median Sales Price: Total Existing Homes, United States $ Composite Housing Affordability Index Median Inc=Qualifying Inc=100 240,000 240 220,000 200 200,000 160 180,000 120 160,000 80 140,000 120,000 40 50 55 60 65 70 75 80 85 90 95 00 05 10 Source: National Association of Realtors /Haver Analytics Median Existing Home Sale Prices vs Affordability • NAR Median Sales Price: Total Existing Homes, United States • $ • Composite Housing Affordability Index • Median Inc=Qualifying Inc=100 • Median Existing Home Sale Prices vs Affordability.EMF (USECON) HXTPM / HACI 4908-11407
Real Estate Loan Growth vs Affordability • Real Estate Loans in Bank Credit: All Commercial Banks • % Change - Year to Year SA, Bil.$ • NAR Median Sales Price: Total Existing Homes, United States • $ • Real Estate Loan Growth vs Affordability.EMF (USECON) FABWR / HXTPM 4408-11407
Total US Housing Starts • Housing Starts • SAAR, Thous.Units • Total US Housing Starts.EMF (USECON) HST 4408-11407
Single Family Home Starts vs. 30-yr Mortgage rates • Housing Starts: 1 Unit • SAAR, Thous.Units • Contract Rates on Commitments: Conventional 30-Yr Mortgages, FHLMC • % • Single Family Home Starts vs. 30-yr Mortgage rates.EMF (USECON) HST1 / FCM 4409-11408
US Median Rent List Price: All Homes NSA, $ Housing Starts: 5 or More Units SAAR, Thous.Units 1,700 1,000 1,600 800 1,500 600 1,400 400 1,300 200 1,200 1,100 0 45 50 55 60 65 70 75 80 85 90 95 00 05 10 Sources: Zillow.com, Census Bureau /Haver Analytics Monthly Rental Prices vs Housing Starts-5 units or more • US Median Rent List Price: All Homes • NSA, $ • Housing Starts: 5 or More Units • SAAR, Thous.Units • Monthly Rental Prices vs Housing Starts-5 units or more.EMF (USECON) USZRL / HST5 4408-11407