Download
1 / 1
10 likes | 141 Vues
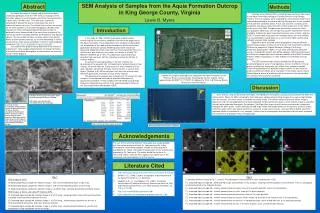
SEM Analysis of Samples from the Aquia Formation Outcrop in King George County, Virginia Lewis B. Myers. Abstract. Methods.

E N D
SEM Analysis of Samples from the Aquia Formation Outcrop in King George County, Virginia Lewis B. Myers Abstract Methods The Aquia formation of Virginia and Maryland has been studied by geologists since the 19th Century. Outcrops of this formation appear in several places around the Chesapeake Bay in both states (Shifflett, p.3). This rock layer is primarily composed of glauconite, quartz, calcareous clay, and a substantial amount of mica. The calcite clay functions as cement for the other particles in the hardened deposits (Shifflett, p.8). Deposits of similar compacted glauconitic greensands are believed to have accumulated in the near shore margins of the oceans during the transition between the Paleocene and Eocene epochs. The generation of these minerals comes from detrital biotite or other parent materials, by marine weathering in neritic environments under anoxic conditions; mainly in unconsolidated sandstone (http://rruff.info/doclib/hom/glauconite.pdf). The scope of this project was to determine if the chemical properties of rock samples obtained from the Aquia Formation matched the text book descriptions of the predominant minerals found in these deposits. Samples were collected from a single location during an hour spent at the Aquia Formation outcrop on Fairview Beach in King George, Virginia. The rock samples were inspected for relative fossil content and separated according to macrofossil density. My goal was to use sections of the rock that contained shells. A rock saw was then used to cut the sandstone into square slices that were small enough to fit on the 26mm stubs used in the SEM. Samples were mounted on aluminum stubs using graphite adhesives. One sample was sputter-coated with 15-30nm of gold to facilitate the beam adjustment process when initially using the SEM. The other rock slices were left uncoated, because it was unlikely that visual problems would occur as a result of the higher accelerating voltages used on these samples. Specimens were scanned and photographed using two different accelerating voltages, of either 20 kV or 30 kV, with the Hitachi S-3400N SEM on the campus of Virginia Wesleyan College. For Energy Dispersive Spectrometry (EDS), X-rays were collected and analyzed using an Oxford EDS system with AZTec software. EDS layered images of elemental composition were created in addition to the Back Scattered Electron (BSE) micrographs, in order to determine the likely minerals present. The EDS layered images clearly showed that the glauconitic greensand deposits were a heterogeneous mixture of different mineral grains, and that the mixing was not uniform from sample to sample. Grains of glauconitic mica, particles of quartz, pyrite, as well as ferric oxides and titanium oxides were all present in the calcite cement matrix. Where obvious pieces of mollusk shells were present, the composition was almost entirely calcium carbonate. Introduction In her study of 1948, Shifflett made several observations concerning the environmental conditions that led to the deposition of the Aquia Formation. These deductions were made by studying both the composition of the rock and the microfossils left by foraminifera populations during the period. Shifflett quotes earlier studies of glauconite deposition which state that this mineral generally forms in a shallow sea, with relatively cool waters, at a depth of at least “50 fathoms” (Shifflett, pp. 41-42). This deposition occurred during a period of high sea level, with the shoreline reaching the fall line of eastern Virginia. An account of outcrop localities in the text matches the description of the samples that I retrieved from Fairview Beach in King George, VA and is listed as “Greensand bed, much weathered in its upper portions, containing Turritella mortoni (shells) in several thick layers” (Shifflett, p.9). All the samples I took from this outcrop were filled with both shells and internal casts of this mollusk. The objective of my project was to determine if the fossil rich rock samples I had collected matched the chemical description of glauconitic sandstone. These samples were identified using Energy Dispersive Spectrometry and the X-ray analysis program AZTec on the Scanning Electron Microscope (SEM). Location of samples collected on an outcrop of the Aquia Formation on the Potomac River, Fairview Beach, King George County, Virginia. Site is approximately 38.3292° N, 77.2419° W, adjacent to Tim's II @ Fairview Beach, Restaurant and Crab House. Discussion Even without using the EDS layered images, the individual mineral grains could clearly be discerned within the calcite matrix. When the BSE micrographs that I took were compared to existing images of the same magnification from the internet, they were nearly a complete structural match. The relative concentrations of silicon, oxygen, potassium and iron corresponded to the levels expected for glauconitic mica grains. A fair amount of quartz and other silicates were dispersed throughout the samples. Small particles of pyrite and titanium could also be recognized amongst the other grains. Quartz particles created large silicon and oxygen peaks on the spectral analysis graphs, while the calcite matrix was clearly verified as a result of a large calcium peak. I was not able to detect any of the individual shells of microfossils in my samples. I believe that the compaction and weathering of the rocks rendered the foraminifera and diatom tests unrecognizable. Compare the micrograph of kaolinite above to the micrograph in Figure 1.B below. http://pubs.usgs.gov/dds/dds-033/USGS_3D/ssx_gif/semkao.gif Scanning electron micrographs showing internal aspects of glauconite pellets: (a) typical lamellar arrangement of dark-green pellets; (b) loose stacking aspect of lighter green patches in dark-green pellets. (from Reference #1, Figure 3.) http://www.clays.org/journal/archive/volume%2033/33-6-473.pdf Fig. 1 BSE images at 20 kV. A) Gold-coated Aquia sample #2, electron image 1, with central kaolinite particle, at x80 mag. B) Gold-coated Aquia sample #2, electron image 1, with central kaolinite particle, at x270 mag. C) Gold-coated Aquia sample #2, electron image 2, at x3000 mag., showing glauconitic crystalline texture. BSE images at 30 kV, and using VP mode at 40Pa. D) Uncoated Aquia sample #5, electron image 3, at x100 mag., showing calcite matrix with quartz particles and large central particle of glauconitic mica. E) Uncoated Aquia sample #6, electron image 1, at x100 mag., showing quartz particles on the left, a central particle of glauconite, and trace amounts of pyrite. F) Uncoated Aquia sample #6, electron image 2, at x250 mag., showing bright particles of iron-titanium composition at top and bottom center of image. • http://rruff.info/doclib/hom/glauconite.pdf • Glauconite particle spectrum for sample #6 Acknowledgements The use of the scanning electron microscope was made possible with the expert guidance of both Dr. Townsend and Dr. Haley. Directions for assembling samples suitable for mounting were provided by Dr. Haley. Instruction for preparation of the samples was provided by Dr. Townsend. The author would like to thank Dr. Townsend and Dr. Haley for their support and supervision in the conception and accomplishment of this venture. Literature Cited http://www.clays.org/journal/archive/volume%2033/33-6-473.pdf Shifflett, F. E. (1948). Eocene stratigraphy and foraminifera of the Aquia Formation. p. 41. Baltimore. Loeblich, A.R., Jr., and Tappan, H.N. (1957). Planktonic Foraminifera of Paleocene and early Eocene age from the Gulf and Atlantic Coastal Plains: U.S. National Museum Bulletin, no. 215, p. 173-198. http://rruff.info/doclib/hom/glauconite.pdf http://originoflife.net/micrographs/graphics/kaolinite_1.jpg Fig. 2 F) Identical electron image to Fig. 1, frame F. All subsequent frames have the same magnification, x250. F1) Uncoated Aquia sample #6, EDS layered image, characteristic X-ray analysis, showing relative locations of the elements. This is a composite of elements listed in the following frames: F2) Uncoated Aquia sample #6, relative concentration of silicon, most of it in quartz particles, some in mica particles. F3) Uncoated Aquia sample #6, relative concentration of sulfur, most of it in pyrite deposits. F4) Uncoated Aquia sample #6, relative concentration of potassium, most of it in mica particles. F5)Uncoated Aquia sample #6, relative concentration of calcium, which makes up the bulk of the calcite matrix in the glauconite. F6) Uncoated Aquia sample #6, relative concentration of titanium, in isolated particles, either mixed with iron, or in separate particles. F7) Uncoated Aquia sample #6, relative concentration of iron, in the form of pyrite, mica, and mixed with titanium.