The Venn Factor
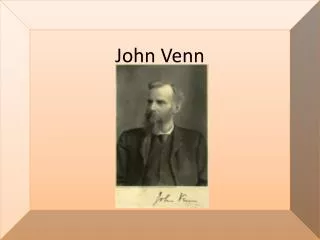
The Venn Factor. Brittany Moye. History of Venn Diagram. Introduced by John Venn in 1880 Uses circles to show the logical relationships of the elements of different sets using the logical operators and, or, and not. Connections. Euler Diagram

The Venn Factor
E N D
Presentation Transcript
The Venn Factor Brittany Moye
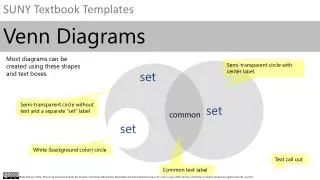
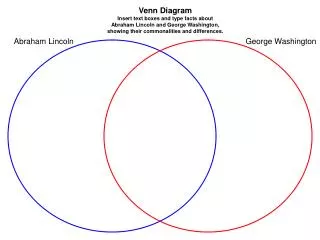
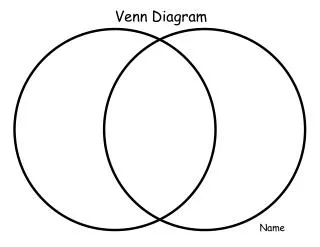
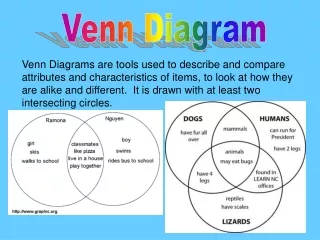
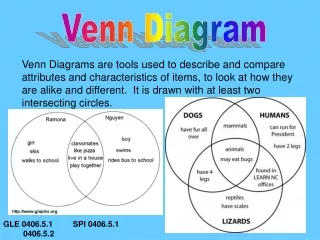
History of Venn Diagram • Introduced by John Venn in 1880 • Uses circles to show the logical relationships of the elements of different sets using the logical operators and, or, and not.
Connections • Euler Diagram • A Venn diagram is a mathematical illustration that shows all of the possible mathematical or logical relationships between sets. A Euler diagram resembles a Venn diagram, but does not necessarily show all possible intersections of the sets. • A Euler diagram is often more useful for showing real world data, because not all sets partially overlap with all other sets.
Things we will investigate in the lesson • Factors • Counting numbers that are multiplied together to form a product. They are numbers that can evenly be divided into another number • Prime number • Numbers that have exactly two factors, one and the number • GFC