Download
1 / 83
960 likes | 1.36k Vues
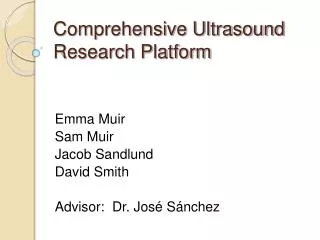
Ultrasound Research Platform for Transmission of Coded Excitation Signals. Emma Muir, Sam Muir, Jacob Sandlund, & David Smith Advisor: Dr. José Sánchez Co-Advisor: Dr. James Irwin. Ultrasound Imaging. Quantitative Ultrasound. Benign. Malignant. [1]. Introduction Outline. Introduction

E N D
Ultrasound Research Platform for Transmission of Coded Excitation Signals Emma Muir, Sam Muir, Jacob Sandlund, & David Smith Advisor: Dr. José Sánchez Co-Advisor: Dr. James Irwin
Quantitative Ultrasound Benign Malignant [1]
Introduction Outline • Introduction • How Ultrasound Works • Coded Excitation • Objective • Motivation • Significance • Design Comparison
Coded Excitation • Conventional Ultrasound [2] • Coded Excitation Ultrasound [2]
Coded Excitation Platforms • Research Platforms • Mostly single-element • Large multi-element • RASMUS RASMUS [3]
Objective • Ultrasound Research Platform Prototype • Arbitrary Waveforms • Coded excitation signals • Multi-element • Beamforming • Reduced size and cost Lecroy Oscilloscope
Motivation • Improve… • Ultrasound Techniques • Ultrasound Research • Reduce size and cost
Significance • Medical Applications • Detect and Diagnose Tumors • Noninvasive • Faster Results
Design Comparison • Previous Designs: • Our Design: Digital Device Transducer D/A Amplifier Digital Device Transducer Switching Amplifier
Our Method • Oversample • 1-bit • Densities represent voltages
Our Method • Transducer acts as a (BP) filter • Smooths / Averages
Encoding Differences • Example: • 0.5 V DC • -1 to 1 V Dynamic range • 8-bit Two’s Complement (-128 to 127): • Value = 64 (0100 0000) • Sigma Delta Modulation: • Oversample • 1-bit
Outline • Introduction • Functional Description • Methods • Results and Discussion • Conclusion • Questions
Outline • Introduction • Functional Description • Methods • Results and Discussion • Conclusion • Questions
System Requirements • Up to 4 transducer channels • Excitations <= 3 μs • SNR > 50 dB
System Block Diagram Generate Waveform 19
System Block Diagram Transmit Waveform 20
System Block Diagram Receive Image 21
System Block Diagram Create Image 22
Data Processing Methods:Conversion to an Image • Time Gain Compensation (TGC) • Attenuation • TGC = Att * Depth * (Probe frequency) • white noise for larger depths
Data Processing Methods:Conversion to an Image • Envelope Detection • Determines the bounds of the processed signal • Detects width and contains the display information • Absolute value of the Hilbert Transform
Outline • Introduction • Functional Description • Methods • Results and Discussion • Conclusion • Questions
Methods • Sigma Delta Modulation • PC/FPGA Interface • FPGA • Data Processing • Pulse Compression • Delay Sum Beamforming
Sigma-Delta Modulation Requirements • < 10% Mean Squared Error (MSE) • 500 M samples/second • Accuracy vs. Overloading (Saturation) • Order = 2nd • OSR = 16 • must be a power of 2 • 16*2 = 32 samples per period
PC/FPGA Interface Requirements • Assign waveform to pins • Independent for each pin • (3 μs) * (500 MHz) = 1500 bits/waveform • 1500 + 36 = 1536 bits/waveform (divisible by 512) • Assign delay to pins • Increments of 4ns = (1/250 MHz) • 250 MHz = memory clock rate of FPGA
PC/FPGA Interface Requirements • Transfer information for 4 pins in < 1 sec • <32 sec for 128 pins • (4 pins) * (1536 bits/waveform) sent within 1 sec • ~6 Kbps • Start transmission
PC/FPGA Interface Methods • UART connection • 115200 baud • Fastest FPGA baud rate • Sends as • 1 start bit • 8 data bits • 2 stop bits • (1536/8)*11*4 = 8448 bits • ~73 ms for 4 channels • ~2.3 s for 128 channels Start Stop Data
FPGA Requirements • Transmit at 500 MHz • Output waveforms in parallel • 4 individualized waveforms • Length of 3 ms per waveform • 1536-bits per waveform
FPGA Methods No Yes
FPGA Methods • Transmit at 500 MHz • Two 250 MHz clock edges (transmits on rising and falling edge) • 250 MHz * 2 = 500 MHz XOR
Data Processing Requirements • Data Processing • Less than 2 minutes • Display an image • Depths between 0.25 cm and 30 cm • Dynamic range between 40 dB and 60 dB