Download
1 / 6
60 likes | 186 Vues
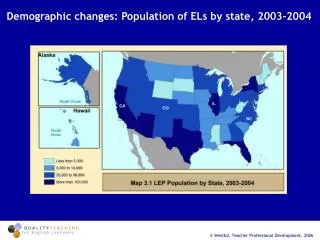
Demographic changes: Population of ELs by state, 2003-2004. The big surprise: More adolescent ELs are native than foreign born. Average scores of 8th graders in reading by English language proficiency and state: 2003. States with the Fastest Growing Immigrant Populations, 2000-2005.

E N D
The big surprise: More adolescent ELs are native than foreign born
Average scores of 8th graders in reading by English language proficiency and state: 2003
States with the Fastest Growing Immigrant Populations, 2000-2005 12 states with 30% + growth US average is 16% Source: MPI’s tabulations of US Census, 2000, & American Community Survey, 2005
Recent arrivals: 42% Recent arrivals: 52% More LEP Children are Native than Foreign Born Source: US Census, 2000. The figures refer to LEP students, ages 5 to 18, currently enrolled in school.
Pct. growth from 2000 58% 83% 36% LEP Children Ages 5 to 17 by Generation Projected Growth: 2000 to 2025 All LEP 2nd gen 3rd gen 1st gen Source: Jeffrey Passel, Pew Hispanic tabulations from Census 2000 5% PUMS. Proportions of children who are LEP computed from Census 2000 data for each generation group. These proportions are held constant and applied to data for (*) 2005 from the March Current Population Survey (CPS) and to (#) projections for 2010 through 2025 done by Passel (2006 forthcoming).