Module 3 Mitigation Options
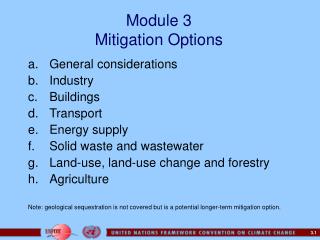
Module 3 Mitigation Options. General considerations Industry Buildings Transport Energy supply Solid waste and wastewater Land-use, land-use change and forestry Agriculture Note: geological sequestration is not covered but is a potential longer-term mitigation option. Module 3a.

Module 3 Mitigation Options
E N D
Presentation Transcript
Module 3Mitigation Options • General considerations • Industry • Buildings • Transport • Energy supply • Solid waste and wastewater • Land-use, land-use change and forestry • Agriculture Note: geological sequestration is not covered but is a potential longer-term mitigation option.
Module 3a General Considerations
Technology Innovations Neededto Mitigate CO2 Emissions • More efficient technologies for energy conversion and utilization in all end-use sectors (transportation, industry, buildings, agriculture; power generation) • New or improved technologies for utilizing alternative energy sources with lower or no GHG emissions (such as natural gas and renewables) • Technologies for CO2 capture and storage (for large-scale industrial processes like electric power generation and fuels production)
RD&D 20000 1981 Commercialization 1983 Photovoltaics 10000 USA 1992 Japan 5000 1995 1982 2000 US(1990)$/kW Windmills (USA) 1000 1987 500 1963 Gas turbines (USA) 1980 200 100 1000 10000 100000 10 100 Cumulative MW installed Source: Nakicenovic, 1996 Technology Policies Have Reduced theCost of GHG-Friendly Energy Systems
Facilitating Energy Efficiency • New investments in power, industry, transport and building infrastructure can be substantially more efficient than existing stock; economic growth is powering a rapid increase in these sectors, and associated emissions. • Almost all countries exhibit declining energy intensity trends for the economic sectors; most countries have some initiatives to promote energy efficiency in these sectors • Technology integration, support, and financing risks are high • Adoption is driven by quality and productivity increases Picture: Courtesy of Emerson Process Management
Module 3b Industry
Industry: Primary Energy Demand by Region • Since 1980, industrial energy demand has stagnated in industrialized countries, but continues to grow rapidly in many developing countries, especially in Asia. Source: IPCC, WGIII, 2002
Industry: Emissions Contribution • Globally, 50% of industry energy consumption made up by • Iron & steel • Chemicals • Petroleum refining • Pulp & paper • Cement • Huge variations between countries • Small industries important in many developing countries.
Industry • Unique opportunities for reducing GHGs because process change with energy efficiency benefits often driven by economic and organizational considerations. • Shortage of capital is a problem in many cases, but gradual improvement in efficiency is likely as investment takes place and new plants are built. • Nature of industrial decision-making implies that energy-cost savings may either be dominant or secondary in specific technical actions. • Potential for large efficiency gains due to rapid stock turnover expected in developing countries.
Industry: Energy Intensity in Pulp and Paper Industry • Energy intensity (energy use per unit of value added) has been reducing over the past two decades in many industries, including iron and steel and pulp and paper. Source: IPCC, WGIII, 2002
Industry: Technical Options • Nature of decision-making in industry demands two classes of options: • Those for which energy cost savings are the dominant decision making criteria --“energy-cost-sensitive” • Those for which broader criteria such as overall production cost and product quality are more important – “non energy-cost-sensitive”
Industry: Energy-cost-sensitive options • Measures for existing processes: • Housekeeping, equipment maintenance, and energy accounting • Energy management systems • Motor drive system improvements • Improved steam production and management • Industrial cogeneration • Heat recovery • Correct dimensioning of motors and mechanical equipment • Adoption of efficient electric motors, pumps, fans, compressors, and boilers. • Fuel switching
Industry: Non Energy-cost-sensitive Options • Major process modifications, for example: • improvements to electric arc furnaces and revamping open-hearth furnaces (steel) • installing improved aluminum smelters, improved ethylene cracking, and conversion from semi-dry to dry process or installation of pre-calcination (cement) • Use of non-carbonated materials for cement clinker production & additives to reduce clinker production. • Installation of new production capacity • More efficient use of materials
Industry: Non CO2 Greenhouse Gases • Nitrous Oxide Emissions from Industrial Processes • PFC Emissions from Aluminium Production • PFCs and Other Substances Used in Semiconductor Production • HFC-23 Emissions from HCFC-22 Production • Emissions of SF6 from the Production, Use and Decommissioning of Gas Insulated Switchgear • Emissions of SF6 from Magnesium Production and Casting
Industry: Mitigation Measures • Research, development, and commercial demonstration of new technologies and processes • Tax incentives for energy efficiency, fuel switching, and reduction in GHG emissions • Removal of market barriers • Government procurement programs • Emission and efficiency standards • Voluntary agreements
Module 3c Buildings (Residential and Commercial Sector)
Buildings: Primary Energy Growth by Sector • Space heating is the dominant energy end-use in temperate areas, space-cooling is more important in tropical areas. • Developed countries account for the vast majority of buildings-related CO2 emissions, but the bulk of the growth in the past two decades was in developing countries.
Buildings: Technical Options • Building Equipment • energy efficient space and heating (heat pumps, CHP) • efficient lighting, air conditioners, refrigerators, and motors • efficient cook stoves, household appliances, and electrical equipment • efficient building energy management and maintenance • Building Thermal Integrity • improved insulation and sealing • energy-efficient windows • proper building orientation • Using Solar Energy • active and passive heating and cooling; climate-sensitive design • effective use of natural light (“daylighting”) Picture: NREL
Buildings: Mitigation Measures • Information programs • Labelling • Demonstration projects • Market based programs • incentives to consumers for new energy-efficient products (in many situations, the fate of less efficient second-hand equipment must be considered). • energy service companies • energy-efficient product development incentives for manufacturers • government or large-customer procurement for energy-efficient products • voluntary initiatives by industry • Regulatory measures • mandated energy-efficiency performance standards, increasingly stringent over time • mandated appliance efficiency standards and efficiency labeling
Module 3d Transport
Transport: Projected GHG Emissions by Mode Source: IEA, World Energy Outlook, 2002
Background. • The transport sector is perhaps the biggest challenge for GHG mitigation. • GHG emissions from the Transport sector are growing more rapidly than any other sector. • Developing country transport emissions are growing faster than in other regions of the world. • Technical and fuel switching solutions for GHG mitigation are particularly challenging in the transport sector.
Transport: Technical Options • Fuel Efficiency Improvements for Vehicles • Changes in vehicle and engine design (e.g. hybrids) • Alternative Fuel Sources • hydrogen or electricity from renewable power • biomass fuels, CNG, LPG, etc. • fuel cell technology • Infrastructure and System Changes • traffic and fleet management systems • mass transportation systems and improved land-use planning. • modal shifts • Transport Demand Management • Reducing travel demand (e.g. through land use changes, telecommunications, etc.)
Transport: Mitigation Measures • Market-based Instruments • increase in fuel tax • incentives for mass transport systems • fiscal incentives and subsides for alternative fuels and vehicles • incentives through vehicle taxes and license fees for more efficient vehicles • Regulatory Instruments • fuel economy standards • vehicle design or alternative fuel mandates • Direct Investment by Governments
Transport: Starting Questions for Analysis • Overall: how can societal preferences be matched with transport options to lower GHG emissions? • Demand forecasting: how much travel or freight movement is expected? • Mode choice: what mix of transport modes will be used to provide passenger and freight services? • Vehicle stock analysis: what is the impact of changing technology (fuel economy, fuel type, emission controls) on fuel use and emissions? • Logistics management: how can activities be reorganized to reduce transport use? • Transport management: how should infrastructure and vehicle flow be managed to reduce congestion or improve efficiency? • Transport planning: what investments are needed to meet growing demand and improve efficiency?
Emissions per Passenger-Km by Mode in Developing Countries Source: Pew Center, 2002
Module 3e Energy Supply
Energy Supply: Conventional • The conventional energy supply system consists of the following sectors: • Oil • Gas • Coal • Nuclear materials • Electric power • Biomass • While the electric power sector is often the largest contributor to GHG emissions, all elements of the fuel cycle need to be considered when assessing the mitigation potential in this sector.
Energy Supply: Fuel Cycle Emissions from Gas and Coal Sectors
Energy Supply: Fuel Cycle Emissions from Nuclear Materials and Electric Power Sectors
Energy Supply Sector: Technical Options • Advanced conversion technologies • advanced pulverized coal combustion • fluidized bed combustion (atmospheric and pressurized) • coal gasification and combined cycle technology • combined heat and power systems • cogeneration • fuel cells/hydrogen • Synthetic fuels from fossil resources w/CO2 sequestration in situ. • Switching to lower carbon fossil fuels and renewable energy • hydropower • wind energy • biomass • geothermal • photovoltaics (PV) • solar thermal • Power station rehabilitation • Reduction of losses in transmission and distribution of electricity and fuels • Improved fuel production and transport • recovery of coal mine methane • coal beneficiation and refining • improved gas and oil flaring Picture: NREL
Energy Supply Sector: Mitigation Measures • Pure market-based instruments • GHG and energy taxes and subsidies • full social cost pricing of energy services • Strict command-and-control regulation • specifying the use of specific fuels • performance and emission standards • Hybrid measures • tradable emission permits • (renewable) portfolio standards, with tradable credits • Voluntary agreements and actions by industry • Research, development, and demonstration activities • Removal of institutional barriers
Energy Supply: Technological and Efficiency Improvements in Power Supply Sector • Large efficiency gains can be achieved by replacing the separate production of heat and power with combined heat and power (CHP) technologies.
Solar Photovoltaics - Flat Plate Photovoltaics - Concentrator Solar Thermal Parabolic Trough Solar Thermal Dish/Stirling Solar Thermal Central Receiver Solar Ponds Hydropower Conventional Pumped Storage Micro-hydro Ocean Tidal Energy Thermal Energy Conversion Wind Horizontal Axis Turbine Vertical Axis Turbine Biomass Direct Combustion Gasification/Pyrolysis Anaerobic Digestion Geothermal Dry Steam Flash Steam Binary Cycle Heat Pump Direct Use Energy Supply: Renewable Energy Technologies
Energy Supply: Solar Photovoltaics • Solar panels using silicon PV conversion have efficiencies in excess of 15 percent, and thin film modules are typically 10 percent. • PV panels are available in sizes from a few watts to 300 watts and produce DC electricity in the range of 12 to 60 volts, and can be used for applications such as: • charging electric lanterns and laptop computers (4 - 6 watts); • packaged systems (20 - 100+ watts) for off-grid residential lighting and entertainment (radio/ cassette, TV/VCR); and • grid-connected power (hundreds of kilowatts to a megawatt or more). • Current costs make solar PVs prohibitive in most situations. • Can be attractive in niche applications, especially for off-grid electrification. • Good prospects for further increases in efficiency and reductions in costs.
Energy Supply: Changes in Wind Electricity Generation Costs in Denmark • Wind power accounts for 0.3% of global installed generation capacity. • It has increased by an average of 25% annually in recent years. • The cost of wind has fallen dramatically, following a classic learning curve.
Energy Supply: Biomass • For mitigation, focus should be on renewable biomass, which has no net CO2 emissions. • Modern conversion of biomass into electricity, liquid and gaseous fuels shows great promise. • In addition, co-firing 10-15% biomass with coal can reduce GHG emissions In developing countries, biomass is a major source of energy services for the poor. Source: IEA
Module 3f Solid Waste and Wastewater
Solid Waste and Wastewater: Introduction • Methane (CH4) is emitted during the anaerobic decomposition of the organic content of solid waste and wastewater. • There are large uncertainties in emissions estimates, due to the lack of information about the waste management practices employed in different countries, the portion of organic wastes that decompose anaerobically and the extent to which these wastes will ultimately decompose. • About 20–40 Mt CH4 (110–230 Mt C), or about 10% of global CH4 emissions from human-related sources, are emitted from landfills and open dumps annually. • Another 30-40 Mt CH4 (170–230 Mt C) annual emissions are from domestic and industrial wastewater disposal. • It is important to remember that the Materials life-cycle has both energy and non-energy related emissions.
Solid Waste: GHG Sources and Sinks associated with Materials Life-Cycle Source: U.S. EPA
Technical Options • Source Reduction • Recycling • Composting • Incineration (including off-set for electricity generation) • Avoidance/waste prevention • Methane Recovery from Solid-waste Disposal • Solid waste disposal facilities (including off-sets for electricity generation and co-generation; gas recovery) • Methane Recovery and/or Reduction from Wastewater • Wastewater treatment plants (including off-sets for electricity generation and co-generation; gas recovery) Landfill Gas Recovery.Picture: University of Tennessee
Measures • Regulatory standards for waste disposal and wastewater management • Provision of market incentives for improved waste management and recovery of methane • Voluntary program to encourage adoption of technical options
Barriers to Methane Recovery • Lack of Information: Lack of awareness of relative costs and effectiveness of alternative technical options, lack of experience with low-cost recently developed anaerobic processes • Economics: Equipment and infrastructure may not be readily affordable. • State of Current Landfills: Existing waste disposal "system" may actually be an open dump or an effluent stream with no treatment and no capital or operating expenses. It is less economical to recover CH4 from smaller dumps and landfills. • Conflicting Interests: Different agencies may be responsible for energy generation, compost supply, and waste management. CH4 recovery and use can introduce new actors into the waste disposal process, potentially disturbing the current balance of economic and political power in the community.
Module 3g LULUCF: Land-use, land-use change and forestry
Key LULUCF Sectors 1. Forestry 2. Rangelands and Grasslands 3. Agriculture
Role of LULUCF Sectors in Global GHG Emissions Global Emissions per year (early 1990's) Fossil fuelsLanduse sectors Carbon Emissions (GtC) 6.0 +- 0.5 1.6 +- 0.4 Methane (Tg) 100 400 Other GHG (Anthropogenic) Significant but < 5 % Net Sequestration (GtC) 0 0.7 +- 0.2 Climate change impacts (2*CO2) Projections show an increase of forest area from 8 - 13 % of the current 82.7 Mi km2, and mixed impacts on drylands and agricultural areas in different regions of the world
Key Steps in LULUCF Mitigation Assessment • Identification and categorization of the mitigation options appropriate for carbon sequestration. • Assessment of the current and future land area available for mitigation options. • Assessment of the current and future demand for products and for land. • Determination of the land area and product scenarios by mitigation option. • Estimation of the C-sequestration per ha. for major available land classes, by mitigation option. • Estimation of unit costs and benefits. • Evaluation of cost-effectiveness indicators. • Development of future carbon sequestration and cost scenarios. • Exploration of policies, institutional arrangements and incentives necessary for the implementation of mitigation options. • Estimation of the national macro-economic effects of these scenarios.
Potential Area Available for Mitigation in Select Countries (million ha)