Download
1 / 24

E N D
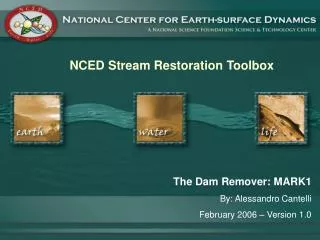
The Stream Restoration Toolbox The Stream Restoration Toolbox consists of current basic research cast into the form of tools that can be used by practitioners. The details of a tool are presented through a PowerPoint presentation, augmented by embedded Excel spreadsheets or other commonly available applications. The toolbox is a vehicle for bringing research findings into practice. While many tools are being developed by NCED Researchers, the opportunity to contribute a tool to the Toolbox is open to the community. For more information on how to contribute please contact Jeff Marr at marrx003@umn.edu.
Statement of liability and usage • This tool is provided free of charge. Use this tool at your own risk. In offering this tool, the following entities and persons do not accept any responsibility or liability for the tool’s use by third parties: • The National Center for Earth-surface Dynamics; • The universities and institutions associated with the National Center for Earth-surface dynamics; and • The authors of this tool. • Users of this tool assume all responsibility for the tool results and application thereof. The readers of the information provided by the Web site assume all risks from using the information provided herein. None of the above-mentioned entities and persons assume liability or responsibility for damage or injury to persons or property arising from any use of the tool, information, ideas or instruction contained in the information provided to you.
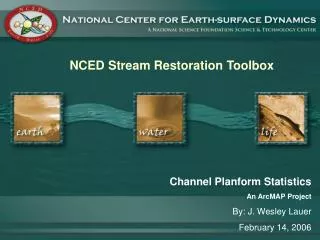
Title Page Tool Title: Channel Planform Statistics Toolbox Tool Author: J. Wesley Lauer Author e-mail: laue0050@umn.edu Version: 1.0 Associated files: 1) PlanformStatisticsTools.ppt 2) planform_statistics_tools_v91.mxd Date: February 2006
Outline of this Document • Introduction to the Tool • Background • Installation • Tool 1: Interpolate Centerlines From Two Bank Lines • Tool 2: Lateral Distance Measurement • Tool 3: Bank Buffer Boxes
Introduction The current availability of digital aerial photography allows for the relatively straightforward comparison of historic and recent imagery of river channels. However, making quantitative measurements of planform characteristics such as width, curvature, and channel migration rate, while not difficult, can be time consuming. These tools automate several of the more time consuming aspects of these measurements at discrete points along a single-thread river. This image of the Bogue Chitto River, Louisiana, shows two channel centerlines developed from bank lines digitized by hand from aerial photography.
Background The channel planform statistics tools are a set of visual basic programs written for ArcMAP 9.1. The tools have been installed in an ArcMAP map file named planform_statistics_tools_v91.mxd. The tools perform three primary functions. 1) Interpolate the centerline of two lines (i.e. two banks that have been digitized by hand from an aerial photograph). Width and local radius of curvature at each evenly-spaced point along the centerline are saved in a text file. 2) Measure the mean lateral normal distances at even increments between two lines developed using tool 1 (i.e. between river channel centerlines at two points in time), and 3) generate a polygon shapefile of boxes adjacent to the channel banks that correspond with a particular centerline point. These boxes are useful if the user wishes to correlate a bank property with one of the observed statistics. This powerpoint presentation presents rudimentary instructions for using the tools. While the instructions are basic, the tools are fairly intuitive so that the user should be able to develop useful information with only a minimal amount of trial and error.
Installation The tools have already been installed in the ArcMAP map planform_statistics_tools_v91.mxd. Technically, the code is associated with UItoolcontrol1, UItoolcontrol2, and UItoolcontrol3 in “This Document” of the project. However, these three UI tools have already been associated with a toolbar in the migration.mxd map, so no installation should be required to access the tools, aside from opening the file planform_statistics_tools_v91.mxd in ArcMAP.
Tool 1: Interpolate Centerlines From Two Bank Lines This tool finds evenly spaced points that are representative of the center of two roughly parallel lines. It then connects these points into a new line. The algorithm used to solve for the points works as follows: The program creates a point a user specified distance from the previous point. It then varies the angle θ until the distance between the closest point on each respective bank line and the new point is nearly equal. (i.e. a = b). This results in a relatively smooth centerline made up of evenly spaced points. The new line is stored in a new shapefile. a a b b q q Final Initial
Tool 1: Interpolate Centerlines From Two Bank Lines (cont.) To use the tool, select the following icon from the toolbar: The tool prompts the user to select the two lines between which the centerline is to be interpolated. These lines should be oriented in the same direction. It then asks for the spacing between the interpolated points. The program seems to run reasonably well when the spacing is about half a channel width or less. The tool is relatively stable in that few geometries cause it to fail. However, it sometimes extends the last segment past the bank lines. Since channel width is measured as part of the interpolation process, channel width at each interpolated point is saved as a separate text file with the same name as the shapefile used to store centerline information.
Centerline interpolated from two bank lines using Tool 1. (1952 photograph, Pearl River, Louisiana/ Mississippi.)
Tool 2: Lateral Distance Measurement This tool finds the average lateral normal distance between the nodes interpolated using tool 1 and a second line, using a best fit Bezier curve that is assumed to represent the most likely path of migration for a particular point. It stores the length of these curves in a new polygon shapefile. To use this tool, select the following icon from the toolbar: The tool asks for the line to which distances are to be measured, and then for the reference line. It will also prompt the user for a path and name for the new shapefile. It is possible that the program will blunder under certain geometries, particularly when the line to which measurements are made ends before the reference line. To make it obvious when this occurs, the program creates screen graphics representing each migration trajectory. If a trajectory looks unreasonably long, the geometry of the centerlines should be changed or that measurement should be discarded.
Tool 2: Lateral Distance Measurement (cont.) For bends that translate primarily downstream without changing form, the trajectory of outward normal migration would change direction, as shown below. In this case, the program has the capability of computing the short-term outward normal migration rate for the reference line (usually the new centerline position) by fitting the Bezier curve between a user-defined bend apex trajectory rather than the historic centerline. Channel Centerline at t D l di Channel Centerline at t +Δt , where The program reports the distance doutput=ci*Δt rather than the rate. Simply dividing doutput by Δt results in a reasonable approximation of the local migration rate.
Tool 2: Lateral Distance Measurement (cont.) The program automatically prompts the user for a shapefile that represents the set of all bend apex trajectories. The shapefile should be a line shapefile in which, for all bends that translated primarily downstream, straight lines connecting the apex of the older and newer bend has been digitized. This line should be snapped to each of the respective centerlines. Apex trajectory line. Such lines should be digitized in a separate shapefile before running the distance measurement tool. The lines should be oriented toward the newer centerline, snapped to each respective centerline, and their forward projection should not intersect the newer centerline. If a line is not present at a particular downstream-translating apex, the program simply fits Bezier Curves between the two centerlines. Channel Centerline at t Channel Centerline at t +Δt
An example of the correction procedure An example of the results of the downstream translation function of Tool 2. The procedure ensures that the method does not predict outward migration at downstream translating bend apices.
Example usage of tools 1 and 2: Centerline interpolated from two bank lines using Tool 1, older photograph. (1952 photograph, Pearl River, Louisiana/ Mississippi.)
Modern (1998) aerial photograph Centerline interpolated from two bank lines using Tool 1, more recent photograph. (1998 photograph, Pearl River, Louisiana/ Mississippi.)
Results of tool 2: Measured lateral migration distances at evenly spaced intervals. (1952 centerline was used as the “to” centerline so that measurements would be stored at even increments along the 1998 centerline.)
This tool finds areas on each bank that correspond with a particular channel centerline point developed using tool 1 (and possibly migration distance computed using tool 2) and saves these as two polygon shapefiles (one each for the left and right banks, respectively). A polygon shapefile representing the union of each set of boxes and the region within the channel corresponding with that set is also saved. Right Buffer Boxes Input Bank and Centerline Geometry Left Buffer Boxes Union Boxes
Tool 3: Bank Buffer Boxes (cont.) The tool creates a sampling corridor of a user-specified width on the upland side of two bank lines. The corridor is then subdivided by projecting evenly spaced lines outward from the centerline (which should be composed of equally long line segments-as is the case for a centerline developed using Tool 1) until they intersect the offset bank lines. In most cases, the subdividing lines are projected normal to the centerline. However, where channel curvature is greater than a threshold value (10° is suggested), the inwardly projected subdividing line is terminated at the point on the outer edge of the sampling corridor nearest to that subdividing line’s origin. This ensures that subdividing lines do not miss the edge of the sampling corridor on the inside of sharp bends. If the above criteria causes two adjacent subdividing lines to intersect inside the outer edge of the sampling corridor, the downstream line is rotated about its origin on the centerline until the intersection occurs at the edge of the sampling corridor.
Tool 3: Bank Buffer Boxes (cont.) To use this tool, select the following icon from the toolbar: The user will first be prompted to select the centerline upon which the boxes will be based. The user is then prompted for the buffer thickness and is asked to select two separate sets of bank lines, each of which should be visible in the current view. (The banks should have been digitized in the direction of flow. The first set of bank lines is used only to compute the length of bank within the buffer boxes. The second is used to generate the buffer boxes. The first and second set of lines may be identical, but this is not required. Bank lines must extend past the end points for the centerline.) The user is next prompted for a maximum expected distance between the channel centerline and the outer edge of the buffer. The program then asks the user for a shapefile name. Union boxes will be stored in this file, while the left and right bank boxes, respectively, will be stored in a file with the same name and the characters “_left” and “_right” appended. Finally, the user is asked for a threshold angle. A value of 10° seems to work well.
Example buffer boxes developed using Tool 3. Lines 1 and 2 identical Bank Line 2 (used to create buffer boxes) Bank Line 1 (used only for bank length)
Disclaimer Notice The information on this site is subject to a disclaimer notice. Thank you for visiting the National Center for Earth Dynamics Web site and reviewing our disclaimer notice. The Web site is for informational purposes only and is not intended to provide specific commercial, legal or other professional advice. It is provided to you solely for your own personal use and not for purposes of distribution, public display, or any other uses by you in any form or manner whatsoever. The information on this Web site is offered on an “as is” basis without warranty. The readers of the information assume all risks from using the information provided herein. • This tool is provided free of charge. Use this tool at your own risk. In offering this tool, the following entities and persons do not accept any responsibility or liability for the tool’s use by third parties: • The National Center for Earth-surface Dynamics; • The universities and institutions associated with the National Center for Earth-surface dynamics; and • The authors of this tool. • Users of this tool assume all responsibility for the tool results and application thereof. The readers of the information provided by the web site assume all risks from using the information provided herein. None of the above-mentioned entities and persons assume liability or responsibility for damage or injury to persons or property arising from any use of the tool, information, ideas or instruction contained in the information provided to you.
Want more information? For more information on this tool or the NCED Stream Restoration Toolbox please contact the author of this tool, J. Wesley Lauer, or the NCED Stream Restoration Project Manager, Jeff Marr at marrx003@umn.edu National Center for Earth-surface Dynamics 2 3rd Ave SE, Minneapolis, MN 55414 612.624.4606