Promoting Traffic Safety: A Collective Effort to Save Lives
Traffic safety is a crucial issue, with over 42,000 deaths and millions injured annually. In Texas alone, 39% of traffic fatalities are alcohol-related, and many victims are unbuckled young males in rural areas. Improving safety measures like seatbelt use, stricter laws on alcohol consumption, and enhanced traffic law enforcement can significantly reduce casualties. Municipal courts play a vital role by handling a large volume of traffic cases and contributing substantial revenue. Together, through awareness and action, we can create safer roads and prevent tragic losses.

Promoting Traffic Safety: A Collective Effort to Save Lives
E N D
Presentation Transcript
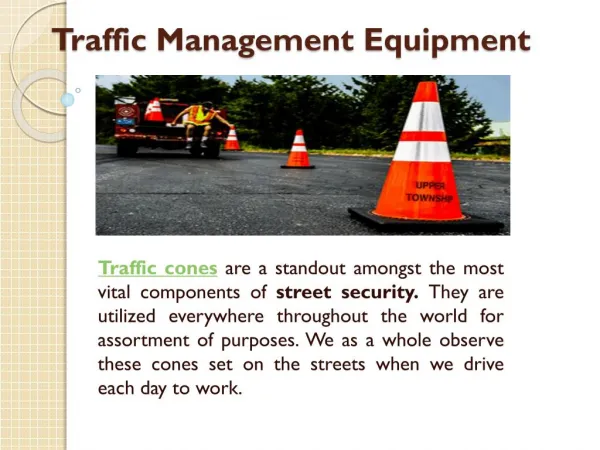
TRAFFIC SAFETY Together We Can Save Lives
THE STATISTICS • 42,636 deaths (Decrease of 0.6% over 2003) • 2.8 million injured • 64% killed were drivers • 29% were passengers • Fatalities/100,000 population – higher for males than females except in over 74 age group National - 2004
THE STATISTICS THE STATISTICS • 3,583 deaths (Decrease of 6% over 2003) Second only to California • 73.9% (2003) of the unintentional deaths in age group 15-24 • 13.4% of traffic fatalities in age group 16-20 • 24.8% of traffic fatalities in age group 16-24 Texas - 2004
THE STATISTICS THE STATISTICS • 39% of fatalities were alcohol-related • 30% had speed as a contributing factor • 40% of drivers with BAC of .08 or greater were speeding Alcohol & Speed - Fatalities
THE STATISTICS THE STATISTICS • Texas seatbelt use increased from 83.2% in 2004 to 89.9% in 2005 • 55% of passenger vehicle occupants that died were not wearing seat belts • Unbuckled are largely young and male, live in rural areas or drive pickups • Most effective countermeasure to prevent fatalities and injuries Seatbelts
THE STATISTICS THE STATISTICS • In 2000, estimated to be $230.6 billion in U.S. & $19.8 billion in Texas • Speed-related crashes - $19.8 billion in U.S. & $3.475 billion in Texas Economic Costs
THE STATISTICS THE STATISTICS • 86% of U.S. and 84.6% of Texas speed-related fatalities occurred on non-interstate roadways • Texas – 41.8% of speed-related fatalities occurred on roadways with speed limit 45 MPH or less • Texas – 58% of fatalities occurred on roadways classified as minor arterials, collectors, or local streets and roadways Types of Roadways Types of Roadways
LAWS – IMPROVE SAFETY & REDUCE FATALITIES • States with primary safety belt use (Texas) 1.03 fatalities/million VMT vs. 1.21 10.69 fatalities/100,000 pop. Vs. 13.13 • Zero alcohol tolerance for minors • Open container law • Graduated licensing system
ENFORCEMENT Enforcement • Click it or ticket it • You Drink & Drive, You Lose • STEP – Specific traffic enforcement program • Monitoring clubs & stores – alcohol sales to minors
THE ROLE OF MUNICIPAL COURTS IN TEXAS (2005) • 8 million cases – 83% of which are traffic & parking • Disposed of 5.6 million traffic & 1.1 million non-traffic cases • 37% of traffic cases – Disposed of by payment of fine or bond forfeiture w/o appearing before judge • $592+ million in revenue • 71.9% of traffic dispositions in Municipal Courts and 26.64% in J.P. Courts
IMPROVING TRAFFIC SAFETY Targeted Enforcement of Traffic Laws • Seat Belts • High accident rate areas • Areas where speeding is prevalent • Time of day and day of week (nights & weekends) • Alcohol sales to minors
IMPROVING TRAFFIC SAFETY Municipal Court Enforcement • Fair and prompt disposition • Professional & Strict • Implementing conditions on deferred dispositions that address driving behavior
IMPROVING TRAFFIC SAFETY Other • Implementing a “safe community” program • Support establishment of DWI courts