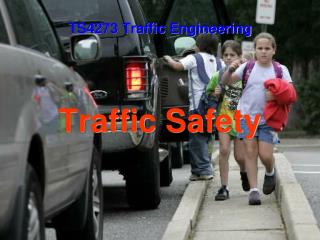
Traffic Safety
Traffic Safety. TS4273 Traffic Engineering. SPEED REALLY DOES KILL. WHO DOES SPEED KILL. WHERE DOES SPEED KILL. HOW DOES SPEED KILL. DID YOU KNOW?. 80% of motorcycle crashes kill or injure rider. While 20% of car crashes kill or injure a vehicle occupant. The First Road Traffic Accident!.

Traffic Safety
E N D
Presentation Transcript
Traffic Safety TS4273 Traffic Engineering
DID YOU KNOW? • 80% of motorcycle crashes kill or injure rider. • While 20% of car crashes kill or injure a vehicle occupant.
The First Road Traffic Accident! • The first recorded Road Traffic Accident was Bridget Driscoll in London, August 17th.1896. • The Coroner stated that it was easily avoidable and should never happen again. • It Has… Over 25 million times!
What is an Accident? • Up until 1650 an accident was seen as either Witchcraft or Gods will. • It was then that social science began by recording births, deaths & later marriages.
Traffic Safety • Safety is the condition in which the risk of harm or damage is limited to an acceptable level • State of mind that make people Thinking, Acting, Behave in such way to minimizing the exposure to danger.
Dampak Kecelakaan Transportasi Darat • GLOBAL • Korban meninggal dunia rata-rata 1 juta jiwa per tahun (1,200,000 persons per year 10 jumbo jet crashes per day!) • 75% terjadi di negara berkembang • Kerugian mencapai 2% GDP (US$ 100 Milyar)
Dampak Kecelakaan Transportasi Darat • NASIONAL • Korban meninggal dunia rata-rata 30 jiwa per hari • Kerugian sekitar US$ 3,5 Milyar sekitar 2,17% GDP Indonesia
CRIME vs. CRASH CLOCK(2002) Crime/Crash Clock 1 murderevery 32 minutes 1 fatality every 12 minutes 1 injuryevery 16 seconds 1 aggravated assaultevery 35 seconds 1 violent crimeevery 22 seconds 1 crashevery 5 seconds
Fatality Rate 100 Million Passenger-Miles in Transport in the United States
Americans Killed in Combat vs.Motor Vehicle Fatalities Americans Killed in Combat vs Motor Vehicle Fatalities - Breakdown
Americans Killed in Combat vs.Motor Vehicle Fatalities Americans Killed in Combat vs Motor Vehicle Fatalities – Big picture 3,070,189 620,219 (225 years) (100 years)
Cars and Weapons! • Cars have killed more people since their invention than all the wars and conflicts put together – including both World Wars!
Causes of Traffic accidents in Malaysia • Combination of traffic composition • Improper intersection design • Provision of street lightning • High traffic volume • Provision of pedestrian crossing • Signal light • Vehicle speed
Statistical Report Road Accident, Royal Malaysian Police. 2005
Statistical Report Road Accident, Royal Malaysian Police. 2005
Approaches used in Road Safety Programmes • Accident Preventions (proactive action) • Accident Reduction (reactive action) • Improvement of hazardous location • Motorcycle lane • Paving of road shoulder • Improvement of dangerous curve
Approaches used in Road Safety Programmes • Pedestrian crossing • Overtaking lane • Street lighting • Road Maintenance • Road Maintenance • Building New Road
Faktor Penyebab Kecelakaan di Indonesia • Pengguna Jalan (lengah, mabuk, ngebut, jarak terlalu dekat, penyeberang jalan, hewan) 93,52% • Jalan (persimpangan, marka/rambu tidak jelas, permukaan licin) 3,23% • Kendaraan (ban pecah, rem blong, kemudi dan lampu tidak berfungsi) 2,76% • Lingkungan (mix traffic, pengawasan dan penegakan hukum, cuaca) 0,49%
The Weak Link! Millions of dollars are spent every year on safer car design and car safety systems. Millions of dollars are spent every year on safer road designs Only a few hundred dollars is spent on the most important factor…THE DRIVER!
Age – the younger driver • Limited skills • Sense of overconfidence • Younger drivers tend to drive faster, drive at night, and drive while drunk. • After the first year of driving, young drivers have acquired the basic control skills of driving but not the tactical and strategic judgment needed for safe driving.
Age – the older driver • Information-processing impairments • Slower response time • A more restricted field of attention • Reduced time-sharing abilities • Reduced visual capacity, especially at night • Older drivers compensate by driving more slowly and by not driving at night. • Older drivers drive less safely at the control level but can compensate with appropriate choices at the tactical and strategic levels.
The Impaired Driver • Alcohol • Involved in approximately 50% of fatal highway accidents in the U.S. • With blood alcohol content as low as 0.05%, drivers react more slowly, are poorer at tracking, are less effective at time-sharing, and show impaired information processing. • One of the most effect interventions may be social norming. • Fatigue has roughly the same effect as alcohol.
Impairment interactions • A combination of fatigue, alcohol, and age can combine to degrade driving performance • The presence of passengers may be distracting and encourage risky behavior. • A young person driving with friends at night and after drinking is an extremely dangerous combination.