Download
1 / 17
170 likes | 461 Vues
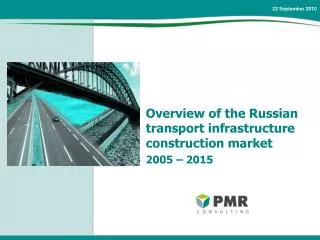
22 September 2010. Prepared by: Stathis Karaplios Head of Consulting Services. Overview of the Russian transport infrastructure construction market 2005 – 2015 . www.pmrconsulting.com. Introduction to the construction industry in Russia. Key facts:.

E N D
22 September 2010 Prepared by:Stathis KarapliosHead of Consulting Services Overview of the Russian transport infrastructure construction market 2005 – 2015
www.pmrconsulting.com Introduction to the construction industry in Russia Key facts: Structure of the Russian construction industry, 2005-2015 Construction output in Russia (billion RUB, net of VAT), 2005-2015 Historical development PMR forecasts • High growth of the construction output between 2005 and 2008 • Crisis resulted in a significant drop in construction output in 2009 (caused mainly by drop in non-residential construction) • Construction output will slightly exceed its 2008 value only in 2011 • Strong growth expected between 2012 and 2015 • Recovery is driven by civil engineering (high input of transport infrastructure construction) and residential segments of the construction industry • Increasing share of civil engineering in the total construction market Nominal CAGR 2010 – 2015 = 14% Nominal CAGR 2005 – 2009 = 24% Source: Rosstat, PMR estimates Overview of the Russian transport infrastructure construction market 2
www.pmrconsulting.com Transport infrastructure construction market Key facts: Transport infrastructure construction market (billion RUB, net of VAT), 2005-2015 Structure of the Russian transport infrastructure construction segment, 2005-2015 Historical development PMR forecasts • High growth of the transport infrastructure construction market between 2005 and 2008 • Crisis resulted in slowdown of the market dynamics, but the market went up by 5% unlike the total construction market • Strong growth expected between 2010 and 2013 • Slowdown in market growth dynamics since 2014 due to the completion of major investments programmes (Sochi, Vladivostok, Kazan) • Roads have the largest share in total transport infrastructure construction market, followed by bridges and railways • Stable share of airports and seaports Nominal CAGR 2010 – 2015 = 15% Nominal CAGR 2005 – 2009 = 17% Source: Rosstat, PMR estimates Overview of the Russian transport infrastructure construction market 3
www.pmrconsulting.com Infrastructure investment funding Comprehensive investment programme developed by the State and funded from the budgets at different levels Framework for private investors to participate in Russia’s transport infrastructure renewal State funds PPPs with secured financing Planned investment projects from private investors • Moscow – St. Petersburg toll-road – RUB 50.1 • Moscow – Minsk toll-road – RUB 18.2bn • Pulkovo Airport – RUB 48.4bn • FTP 2010-2015 (roads) – RUB 3,611bn • FTP 2010-2015 (railways) – RUB 3,147bn • Development of Far East and Zabaykalye – RUB 113bn • Construction of Olympic Venues, Sochi – RUB 19bn • 2013 Kazan Universiade – RUB 32bn • Other special programmes • Ulak-Elga railway – RUB 41bn • Naryn-Lugokan railway – >RUB 30bn • In addition to the federal budget, Russian transport infrastructure is financed from: • Regional budgets (constituent territories of the Russian Federation) • Municipal budgets (Russian cities) • State companies (RZD, Avtodor) • Private investors, PPPs • Russian Investment Fund Key role of the federal budget…. • …as it supports lower level administration • Subsidies (c. 22% in 2009) • Federal loans to constituent territories (up to 50bn RUR in 2010 for construction, reconstruction and maintenance of regional roads) Overview of the Russian transport infrastructure construction market 4
www.pmrconsulting.com 340 311 306 291 215 153 2010 2011 2012 2013 2014 2015 Infrastructure investment funding Background: Key facts on Russian PPP: Significant growth in non-budget investments in transport infrastructure expected • The Russian transport infrastructure program is one of the largest programmes outside China • To assist Government in meeting the largeinvestments, a significant part of the funding is expected to be in the form of PPPs • Government is committed to provide financial resources to support the participation in concessions Nominal CAGR 2010 – 2015 = 15% • Federal Concession law is in place and operational • Average concession term for projects is 30 years • Significant pipeline of PPP (all-type of infrastructure facilities) are currently being discussed Overview of the Russian transport infrastructure construction market 5
www.pmrconsulting.com Infrastructure investment funding Russia to increase fuel tax Fuel tax overview • A fuel tax is an excise tax imposed on the sale of fuel • Taxation on motor fuels are generally considered the most efficient way to charge road users as it is easy to collect and administer and is relatively equitable • Motor fuel taxes remains a powerful instrument to generate revenues for road infrastructure and its maintenance • On a global scale, significant portion of road infrastructure expenditures is financed via fuel taxes • In July 2010, President Dmitry Medvedev approved the government's proposal to increase the excise tax on gasoline by 1 ruble per litre annually over the coming three years • The government expects that after the tax is increased, the federal budget would receive an additional RUB 536bn in the period 2011-2013 • The revenue is expected to enter the Federal Road Fund to finance road construction and repairs Comparison of fuel tax systems: the US vs. Western Europe • Varying from state to state, on average, the US fuel tax is about 12 cents per litre of gasoline and 13 cents per litre for diesel • The fuel taxes revenue go to Highway Trust Fund and are mainly used to cover all direct expenditure for roads and highways United States Expected additional revenue from the fuel tax increase Western Europe • Fuel taxes are significantly higher in Western Europe. For example, in UK the fuel tax is 50.35 pence per litre, accounting for over 60% of the pump price • In many western European countries, fuel taxes are used to reduce dependence on fossil fuels, traffic and pollution • Source: PMR, American Petroleum Institute, the Association of British Drivers, public sources Overview of the Russian transport infrastructure construction market 6
www.pmrconsulting.com Transport infrastructure construction:roads Road infrastructure construction market value (billion RUB, net of VAT), 2005-2015 Historical development PMR forecasts Nominal CAGR 2010 – 2015 = 16% Nominal CAGR 2005 – 2009 = 20% • Numbers based on FTP spending on road infrastructure and non-FTP projects + adjustments • Market value more than doubled between 2005 and 2009 • High growth between 2005 and 2008 • Moderate growth during the crisis • Numbers based on planned FTP spending on road infrastructure and their assumed implementation, as well as non-FTP projects (e.g. PPP, Sochi, Valdivostok, Kazan) • Will remain the largest sub-segment of total transport infrastructure construction market • High growth between 2010 and 2013, slowdown in 2014 and 2015 (Sochi, Vladivostok and Kazan related investments completed by then) • Gradually increasing FTP projects implementation rate • Important role of the budget for capital repair and maintenance Overview of the Russian transport infrastructure construction market 7
www.pmrconsulting.com Federal Federal highways highways 35% 44% Other roads Other 56% roads 65% Federal highways, 41% Other roads, 59% Transport infrastructure construction:roads Allocation of Government funds in 2009 Road repair and maintenance Road construction Total = RUB 286bn Total = RUB187bn Key facts • The total length of federal roads is c. 50,000 km, which is less than 10% of Russia’s entire road network. • The backbone of Russia’s road network is 24 major federal roads, which account for the majority of road traffic in the country. • Investments in construction of federal roads have been always fulfilled Total = RUB 473bn Overview of the Russian transport infrastructure construction market 8
www.pmrconsulting.com Transport infrastructure construction:railways Railway infrastructure construction market value (billion RUB, net of VAT), 2005-2015 Historical development PMR forecasts Nominal CAGR 2010 – 2015 = 15% Nominal CAGR 2005 – 2009 = 5% • Numbers based on planned FTP spending on road infrastructure and their assumed implementation, non-FTP projects (e.g. PPP, Sochi) • Impressive growth between 2010 and 2012, stable growth between 2013 and 2015 (Sochi related investments to be completed by then) • Relatively stable FTP projects implementation rate • Numbers based on FTP spending on road infrastructure and non-FTP projects + adjustments • Key role in cargo transportation between Far East and European part of Russia • Moderate growth during the crisis, despite overall construction market decline, substantial decline in 2010 Overview of the Russian transport infrastructure construction market 9
www.pmrconsulting.com Transport infrastructure construction:railways Key facts • Russia has 85,281 km long railway network - the 3rd largest in world after US and China • The railway system plays a particularly important role in freight transportation in Russia due to the inherent limitations of other forms of transportation in the country • Railway remains the most important link between European part of Russia and regions rich with natural resources as Siberia and Far East • Russia’s railway network has had limited capacity expansion or investments since Soviet times and as a result existing infrastructure has been steady deteriorating • Resource extraction is heavily dependant on the railway • Transport strategy among other things includes initiatives to increase weight of cargo trains and creation of network of high-speed passenger trains Overview of the Russian transport infrastructure construction market 10
www.pmrconsulting.com Transport infrastructure construction:bridges Bridge infrastructure construction market value (billion RUB, net of VAT), 2005-2015 Historical development PMR forecasts Nominal CAGR 2010 – 2015 = 12% Nominal CAGR 2005 – 2009 = 21% • Numbers based on planned FTP spending on road and railway infrastructure, their assumed implementation and share of bridges in the total costs, non-FTP projects (e.g. PPP, Sochi, Valdivostok, Kazan) • High growth between 2010 and 2013, decline in 2014 (Sochi, Vladivostok and Kazan related investments completed by then) • Stable growth • Market value expected to almost double by 2015 • Numbers based on the running meters of bridges completed and average construction cost • Value of the market more than doubled between 2005 and 2009 • Key for road and railway infrastructure development, strongly linked with their development • Budget for bridges is priority due to their crucial role in road capacity improvement Overview of the Russian transport infrastructure construction market 11
www.pmrconsulting.com Transport infrastructure construction:bridges Key facts Example of completed project • Construction and reconstruction of bridges, overpasses and multi-level intersections is critical for development of road infrastructure and elimination of traffic bottlenecks • Bridges are critical for development of transport infrastructure and for social and economic development of regions. • Bridge construction is one of the most complex and technologically challenging segments of construction requiring specialised expertise, which limits number of potential contractors for bridge projects. Construction of bridge over the Karma River near Perm, 2008 Key bridge projects 2010 – 2015 • Combined highway and railway road from Adler to Alpika-Service (46 bridges and overpasses with total length of 32km) • Cable stayed bridge on Russky Island in Vladivostok • Golden Horn Bay bridge in Vladivostok • First segment of Moscow – St. Petersburg toll-road (31 overpasses, 5 bridges, 3 pedestrian bridges) • Rail bridge over Lubovka river • The bridge over the Kama river connecting the M-7 Volga federal highway and the P-242 federal highway from Perm to Yekaterinburg • The project involved construction of a 1,735 meter-long bridge and about 25 km of roads to bypass the city. • Construction of the bridge allowed to divert traffic from the city of Perm and thus ensured smooth access to the M-7 Volga federal highway. Overview of the Russian transport infrastructure construction market 12
www.pmrconsulting.com Transport infrastructure construction:airports & ports Airports – key facts Seaports – key facts • Russia’s airport infrastructure is inadequate both in terms of airport size and infrastructure (terminal and runway capacity) as well as the total number of airports • Major Russian airports are currently operating at or near full capacity and offering passengers a substandard experience often with length delays and inefficient service • Development of hub airports in the South, Siberia and Far East is necessary; now Moscow represents 2/3 of total Russia’s air traffic • The number of the airports in Russia has been in decline since the early 1990s from more than 1,300 to 329 airports in 2009, of which only 62% have a paved runway • Sea gateways are vital for Russia’s overseas exports and imports • However, the average age of Russia’s major port facilities is close to 30 years and its effective capacity utilization is running close to 100% • Lack of deepwater harbours at most ports, long shipping channels between ports and the sea further hamper the potential growth in cargo turnover • Sea gateways are vital for Russia’s overseas exports and imports • However, the average age of Russia’s major port facilities is close to 30 years and its effective capacity utilization is running close to 100% • Lack of deepwater harbours at most ports, long shipping channels between ports and the sea further hamper the potential growth in cargo turnover Overview of the Russian transport infrastructure construction market 13
www.pmrconsulting.com Competitive landscape:introduction Market share by volume of works conducted by own forces, 2009 Market share by revenue, 2009 TOTAL: RUB 436.3bn • The Russian transport infrastructure competitive landscape can be split into two distinct groups: • minor regional companies providing unsophisticated small-scale construction, repair and maintenance services, • companies with sufficient expertise and resources to successfully implement large-scale project of regional or nationwide importance. • Two key types of companies include: • specialized providers of general contractor and engineering services, • construction companies, carrying out most of the works by own forces. Overview of the Russian transport infrastructure construction market 14
www.pmrconsulting.com Competitive landscape: selected key players overview Overview of the Russian transport infrastructure construction market 15
www.pmrconsulting.com Summary: SWOT analysis Overview of the Russian transport infrastructure construction market 16
Contact details Stathis Karaplios Head of Consulting Services tel. +48 12 269 22 52 mob:+48 607 979 520 stathis.karaplios@pmrconsulting.com ul. Dekerta 24, 30-703 Krakow, Poland tel. +/48 12/ 618 90 00, fax: +/48 12/ 618 90 08 www.pmrconsulting.com www.pmrcorporate.com