Download
1 / 91
910 likes | 932 Vues
Examination of middle school students' helmet and seat belt utilization while biking, rollerblading, skateboarding, and riding in a car across different grades, sexes, and race/ethnicities in West Virginia from 2001-2017. Data includes trends over the years and significance levels from logistic regression models.

E N D
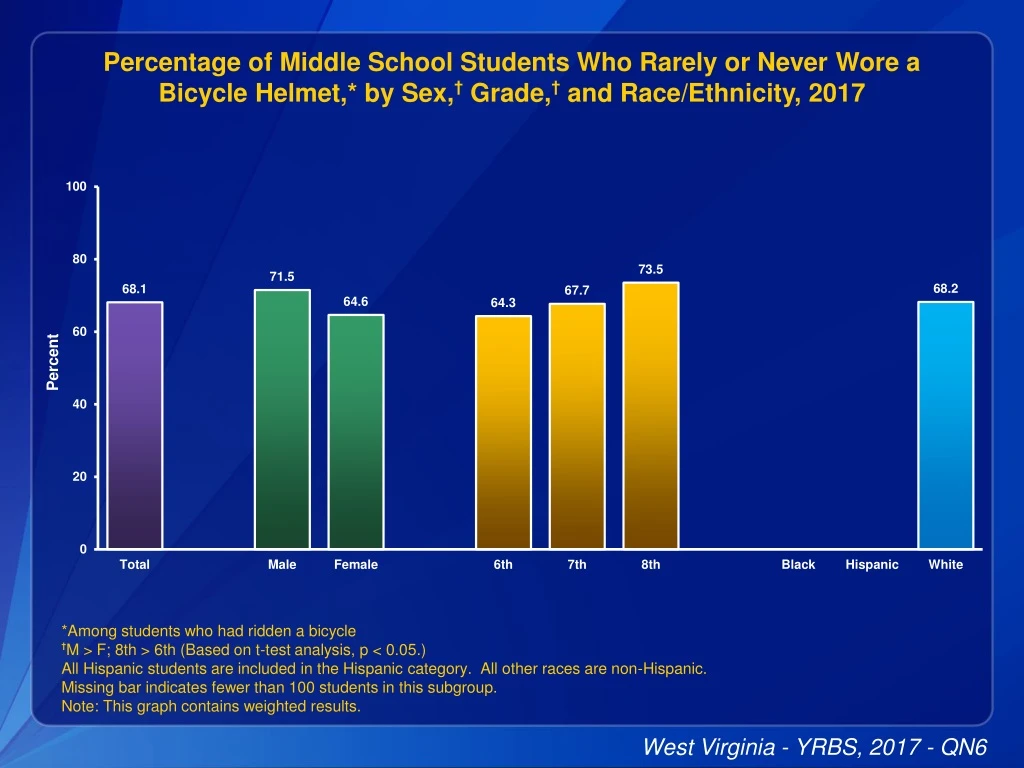
Percentage of Middle School Students Who Rarely or Never Wore a Bicycle Helmet,* by Sex,† Grade,† and Race/Ethnicity, 2017 *Among students who had ridden a bicycle †M > F; 8th > 6th (Based on t-test analysis, p < 0.05.) All Hispanic students are included in the Hispanic category. All other races are non-Hispanic. Missing bar indicates fewer than 100 students in this subgroup. Note: This graph contains weighted results. West Virginia - YRBS, 2017 - QN6
Percentage of Middle School Students Who Rarely or Never Wore a Bicycle Helmet,* 2001-2017† *Among students who had ridden a bicycle †Increased, 2001-2009, decreased, 2009-2017 [Based on linear and quadratic trend analyses using logistic regression models controlling for sex, race/ethnicity, and grade (p < 0.05). Significant linear trends (if present) across all available years are described first followed by linear changes in each segment of significant quadratic trends (if present).] Data not available for 2003, 2005. Note: This graph contains weighted results. West Virginia - YRBS, 2001-2017 - QN6
Percentage of Middle School Students Who Rarely or Never Wore a Helmet When Rollerblading or Skateboarding,* by Sex, Grade,† and Race/Ethnicity, 2017 *Among students who used rollerblades or rode a skateboard †8th > 7th (Based on t-test analysis, p < 0.05.) All Hispanic students are included in the Hispanic category. All other races are non-Hispanic. Missing bar indicates fewer than 100 students in this subgroup. Note: This graph contains weighted results. West Virginia - YRBS, 2017 - QN7
Percentage of Middle School Students Who Rarely or Never Wore a Helmet When Rollerblading or Skateboarding,* 2001-2017† *Among students who used rollerblades or rode a skateboard †Increased 2001-2017, increased 2001-2009, decreased 2009-2017 [Based on linear and quadratic trend analyses using logistic regression models controlling for sex, race/ethnicity, and grade (p < 0.05). Significant linear trends (if present) across all available years are described first followed by linear changes in each segment of significant quadratic trends (if present).] Data not available for 2003, 2005. Note: This graph contains weighted results. West Virginia - YRBS, 2001-2017 - QN7
Percentage of Middle School Students Who Rarely or Never Wore a Seat Belt,* by Sex, Grade,† and Race/Ethnicity, 2017 *When riding in a car †8th > 6th (Based on t-test analysis, p < 0.05.) All Hispanic students are included in the Hispanic category. All other races are non-Hispanic. Note: This graph contains weighted results. West Virginia - YRBS, 2017 - QN8
Percentage of Middle School Students Who Rarely or Never Wore a Seat Belt,* 2001-2017† *When riding in a car †Decreased 2001-2017, decreased 2001-2013, decreased 2013-2017 [Based on linear and quadratic trend analyses using logistic regression models controlling for sex, race/ethnicity, and grade (p < 0.05). Significant linear trends (if present) across all available years are described first followed by linear changes in each segment of significant quadratic trends (if present).] Data not available for 2003, 2005. Note: This graph contains weighted results. West Virginia - YRBS, 2001-2017 - QN8
Percentage of Middle School Students Who Ever Rode with a Driver Who Had Been Drinking Alcohol,* by Sex, Grade,† and Race/Ethnicity, 2017 *In a car †7th > 6th, 8th > 6th (Based on t-test analysis, p < 0.05.) All Hispanic students are included in the Hispanic category. All other races are non-Hispanic. Note: This graph contains weighted results. West Virginia - YRBS, 2017 - QN9
Percentage of Middle School Students Who Ever Rode with a Driver Who Had Been Drinking Alcohol,* 2001-2017† *In a car †Decreased 2001-2017, decreased 2001-2009, decreased 2009-2017 [Based on linear and quadratic trend analyses using logistic regression models controlling for sex, race/ethnicity, and grade (p < 0.05). Significant linear trends (if present) across all available years are described first followed by linear changes in each segment of significant quadratic trends (if present).] Data not available for 2003, 2005. Note: This graph contains weighted results. West Virginia - YRBS, 2001-2017 - QN9
Percentage of Middle School Students Who Ever Carried a Weapon,* by Sex,† Grade, and Race/Ethnicity,† 2017 *Such as a gun, knife, or club †M > F; W > B (Based on t-test analysis, p < 0.05.) All Hispanic students are included in the Hispanic category. All other races are non-Hispanic. Note: This graph contains weighted results. West Virginia - YRBS, 2017 - QN10
Percentage of Middle School Students Who Ever Carried a Weapon,* 2001-2017† *Such as a gun, knife, or club †No change 2001-2017 [Based on linear and quadratic trend analyses using logistic regression models controlling for sex, race/ethnicity, and grade (p < 0.05). Significant linear trends (if present) across all available years are described first followed by linear changes in each segment of significant quadratic trends (if present).] Data not available for 2003, 2005. Note: This graph contains weighted results. West Virginia - YRBS, 2001-2017 - QN10
Percentage of Middle School Students Who Were Ever in a Physical Fight, by Sex,* Grade,* and Race/Ethnicity,* 2017 *M > F; 8th > 6th; H > W (Based on t-test analysis, p < 0.05.) All Hispanic students are included in the Hispanic category. All other races are non-Hispanic. Note: This graph contains weighted results. West Virginia - YRBS, 2017 - QN11
Percentage of Middle School Students Who Were Ever in a Physical Fight, 2001-2017* *Decreased 2001-2017, no change 2001-2011, decreased 2011-2017 [Based on linear and quadratic trend analyses using logistic regression models controlling for sex, race/ethnicity, and grade (p < 0.05). Significant linear trends (if present) across all available years are described first followed by linear changes in each segment of significant quadratic trends (if present).] Data not available for 2003, 2005. Note: This graph contains weighted results. West Virginia - YRBS, 2001-2017 - QN11
Percentage of Middle School Students Who Were Ever Bullied on School Property, by Sex,* Grade, and Race/Ethnicity, 2017 *F > M (Based on t-test analysis, p < 0.05.) All Hispanic students are included in the Hispanic category. All other races are non-Hispanic. Note: This graph contains weighted results. West Virginia - YRBS, 2017 - QN12
Percentage of Middle School Students Who Were Ever Bullied on School Property, 2009-2017* *No change 2009-2017 [Based on linear trend analyses using logistic regression models controlling for sex, race/ethnicity, and grade (p < 0.05).] Note: This graph contains weighted results. West Virginia - YRBS, 2009-2017 - QN12
Percentage of Middle School Students Who Were Ever Electronically Bullied,* by Sex,† Grade,† and Race/Ethnicity, 2017 *Counting being bullied through texting, Instagram, Facebook, or other social media †F > M; 7th > 6th, 8th > 6th (Based on t-test analysis, p < 0.05.) All Hispanic students are included in the Hispanic category. All other races are non-Hispanic. Note: This graph contains weighted results. West Virginia - YRBS, 2017 - QN13
Percentage of Middle School Students Who Were Ever Electronically Bullied,* 2011-2017† *Counting being bullied through texting, Instagram, Facebook, or other social media †No change 2011-2017 [Based on linear trend analyses using logistic regression models controlling for sex, race/ethnicity, and grade (p < 0.05).] Note: This graph contains weighted results. West Virginia - YRBS, 2011-2017 - QN13
Percentage of Middle School Students Who Ever Seriously Thought About Killing Themselves, by Sex,* Grade,* and Race/Ethnicity, 2017 *F > M; 7th > 6th, 8th > 6th (Based on t-test analysis, p < 0.05.) All Hispanic students are included in the Hispanic category. All other races are non-Hispanic. Note: This graph contains weighted results. West Virginia - YRBS, 2017 - QN14
Percentage of Middle School Students Who Ever Seriously Thought About Killing Themselves, 2001-2017* *No change 2001-2017 [Based on linear and quadratic trend analyses using logistic regression models controlling for sex, race/ethnicity, and grade (p < 0.05). Significant linear trends (if present) across all available years are described first followed by linear changes in each segment of significant quadratic trends (if present).] Data not available for 2003, 2005. Note: This graph contains weighted results. West Virginia - YRBS, 2001-2017 - QN14
Percentage of Middle School Students Who Ever Made a Plan About How They Would Kill Themselves, by Sex,* Grade,* and Race/Ethnicity, 2017 *F > M; 7th > 6th, 8th > 6th (Based on t-test analysis, p < 0.05.) All Hispanic students are included in the Hispanic category. All other races are non-Hispanic. Note: This graph contains weighted results. West Virginia - YRBS, 2017 - QN15
Percentage of Middle School Students Who Ever Made a Plan About How They Would Kill Themselves, 2001-2017* *No change 2001-2017 [Based on linear and quadratic trend analyses using logistic regression models controlling for sex, race/ethnicity, and grade (p < 0.05). Significant linear trends (if present) across all available years are described first followed by linear changes in each segment of significant quadratic trends (if present).] Data not available for 2003, 2005. Note: This graph contains weighted results. West Virginia - YRBS, 2001-2017 - QN15
Percentage of Middle School Students Who Ever Tried to Kill Themselves, by Sex,* Grade,* and Race/Ethnicity,* 2017 *F > M; 7th > 6th, 8th > 6th; H > W (Based on t-test analysis, p < 0.05.) All Hispanic students are included in the Hispanic category. All other races are non-Hispanic. Note: This graph contains weighted results. West Virginia - YRBS, 2017 - QN16
Percentage of Middle School Students Who Ever Tried to Kill Themselves, 2001-2017* *No change 2001-2017 [Based on linear and quadratic trend analyses using logistic regression models controlling for sex, race/ethnicity, and grade (p < 0.05). Significant linear trends (if present) across all available years are described first followed by linear changes in each segment of significant quadratic trends (if present).] Data not available for 2003, 2005. Note: This graph contains weighted results. West Virginia - YRBS, 2001-2017 - QN16
Percentage of Middle School Students Who Ever Tried Cigarette Smoking,* by Sex,† Grade,† and Race/Ethnicity, 2017 *Even one or two puffs †M > F; 7th > 6th, 8th > 6th (Based on t-test analysis, p < 0.05.) All Hispanic students are included in the Hispanic category. All other races are non-Hispanic. Note: This graph contains weighted results. West Virginia - YRBS, 2017 - QN17
Percentage of Middle School Students Who Ever Tried Cigarette Smoking,* 2001-2017† *Even one or two puffs †Decreased 2001-2017, decreased 2001-2013, decreased 2013-2017 [Based on linear and quadratic trend analyses using logistic regression models controlling for sex, race/ethnicity, and grade (p < 0.05). Significant linear trends (if present) across all available years are described first followed by linear changes in each segment of significant quadratic trends (if present).] Data not available for 2003, 2005. Note: This graph contains weighted results. West Virginia - YRBS, 2001-2017 - QN17
Percentage of Middle School Students Who Tried Cigarette Smoking for the First Time Before Age 11 Years,* by Sex, Grade,† and Race/Ethnicity, 2017 *Even one or two puffs †7th > 6th, 8th > 6th (Based on t-test analysis, p < 0.05.) All Hispanic students are included in the Hispanic category. All other races are non-Hispanic. Missing bar indicates fewer than 100 students in this subgroup. Note: This graph contains weighted results. West Virginia - YRBS, 2017 - QN18
Percentage of Middle School Students Who Currently Smoked Cigarettes,* by Sex, Grade,† and Race/Ethnicity, 2017 *On at least 1 day during the 30 days before the survey †7th > 6th, 8th > 6th (Based on t-test analysis, p < 0.05.) All Hispanic students are included in the Hispanic category. All other races are non-Hispanic. Note: This graph contains weighted results. West Virginia - YRBS, 2017 - QN19
Percentage of Middle School Students Who Currently Smoked Cigarettes,* 2001-2017† *On at least 1 day during the 30 days before the survey †Decreased 2001-2017, decreased 2001-2011, decreased 2011-2017 [Based on linear and quadratic trend analyses using logistic regression models controlling for sex, race/ethnicity, and grade (p < 0.05). Significant linear trends (if present) across all available years are described first followed by linear changes in each segment of significant quadratic trends (if present).] Data not available for 2003, 2005. Note: This graph contains weighted results. West Virginia - YRBS, 2001-2017 - QN19
Percentage of Middle School Students Who Currently Smoked Cigarettes Frequently,* by Sex, Grade, and Race/Ethnicity, 2017 *On 20 or more days during the 30 days before the survey All Hispanic students are included in the Hispanic category. All other races are non-Hispanic. Note: This graph contains weighted results. West Virginia - YRBS, 2017 - QNFRCIG
Percentage of Middle School Students Who Currently Smoked Cigarettes Frequently,* 2001-2017† *On 20 or more days during the 30 days before the survey †Decreased 2001-2017, decreased 2001-2011, decreased 2011-2017 [Based on linear and quadratic trend analyses using logistic regression models controlling for sex, race/ethnicity, and grade (p < 0.05). Significant linear trends (if present) across all available years are described first followed by linear changes in each segment of significant quadratic trends (if present).] Data not available for 2003, 2005. Note: This graph contains weighted results. West Virginia - YRBS, 2001-2017 - QNFRCIG
Percentage of Middle School Students Who Currently Smoked Cigarettes Daily,* by Sex, Grade,† and Race/Ethnicity, 2017 *On all 30 days during the 30 days before the survey †8th > 7th (Based on t-test analysis, p < 0.05.) All Hispanic students are included in the Hispanic category. All other races are non-Hispanic. Note: This graph contains weighted results. West Virginia - YRBS, 2017 - QNDAYCIG
Percentage of Middle School Students Who Currently Smoked Cigarettes Daily,* 2001-2017† *On all 30 days during the 30 days before the survey †Decreased 2001-2017 [Based on linear and quadratic trend analyses using logistic regression models controlling for sex, race/ethnicity, and grade (p < 0.05). Significant linear trends (if present) across all available years are described first followed by linear changes in each segment of significant quadratic trends (if present).] Data not available for 2003, 2005. Note: This graph contains weighted results. West Virginia - YRBS, 2001-2017 - QNDAYCIG
Percentage of Middle School Students Who Smoked More Than 10 Cigarettes Per Day,* by Sex, Grade, and Race/Ethnicity, 2017 *On the days they smoked during the 30 days before the survey, among students who currently smoked cigarettes All Hispanic students are included in the Hispanic category. All other races are non-Hispanic. Missing bar indicates fewer than 100 students in this subgroup. Note: This graph contains weighted results. West Virginia - YRBS, 2017 - QN20
Percentage of Middle School Students Who Ever Used an Electronic Vapor Product,* by Sex,† Grade,† and Race/Ethnicity, 2017 *Including e-cigarettes, e-cigars, e-pipes, vape pipes, vaping pens, e-hookahs, and hookah pens [such as blu, NJOY, Vuse, MarkTen, Logic, Vapin Plus, eGo, and Halo] †M > F; 7th > 6th, 8th > 6th (Based on t-test analysis, p < 0.05.) All Hispanic students are included in the Hispanic category. All other races are non-Hispanic. Note: This graph contains weighted results. West Virginia - YRBS, 2017 - QN21
Percentage of Middle School Students Who Ever Used an Electronic Vapor Product,* 2015-2017† *Including e-cigarettes, e-cigars, e-pipes, vape pipes, vaping pens, e-hookahs, and hookah pens [such as blu, NJOY, Vuse, MarkTen, Logic, Vapin Plus, eGo, and Halo] †Decreased 2015-2017 [Based on linear trend analyses using logistic regression models controlling for sex, race/ethnicity, and grade (p < 0.05).] Note: This graph contains weighted results. West Virginia - YRBS, 2015-2017 - QN21
Percentage of Middle School Students Who Currently Used an Electronic Vapor Product,* by Sex, Grade,† and Race/Ethnicity,† 2017 *Including e-cigarettes, e-cigars, e-pipes, vape pipes, vaping pens, e-hookahs, and hookah pens [such as blu, NJOY, Vuse, MarkTen, Logic, Vapin Plus, eGo, and Halo], on at least 1 day during the 30 days before the survey †7th > 6th, 8th > 6th; H > W (Based on t-test analysis, p < 0.05.) All Hispanic students are included in the Hispanic category. All other races are non-Hispanic. Missing bar indicates fewer than 100 students in this subgroup. Note: This graph contains weighted results. West Virginia - YRBS, 2017 - QN22
Percentage of Middle School Students Who Currently Used an Electronic Vapor Product,* 2015-2017† *Including e-cigarettes, e-cigars, e-pipes, vape pipes, vaping pens, e-hookahs, and hookah pens [such as blu, NJOY, Vuse, MarkTen, Logic, Vapin Plus, eGo, and Halo], on at least 1 day during the 30 days before the survey †Decreased 2015-2017 [Based on linear trend analyses using logistic regression models controlling for sex, race/ethnicity, and grade (p < 0.05).] Note: This graph contains weighted results. West Virginia - YRBS, 2015-2017 - QN22
Percentage of Middle School Students Who Usually Got Their Own Electronic Vapor Products by Buying Them in a Store,* by Sex, Grade, and Race/Ethnicity, 2017 *Such as a convenience store, supermarket, discount store, gas station, or vape store, during the 30 days before the survey, among students who currently used electronic vapor products All Hispanic students are included in the Hispanic category. All other races are non-Hispanic. Missing bar indicates fewer than 100 students in this subgroup. Note: This graph contains weighted results. West Virginia - YRBS, 2017 - QN23
Percentage of Middle School Students Who Currently Used Smokeless Tobacco,* by Sex,† Grade,† and Race/Ethnicity,† 2017 *Chewing tobacco, snuff, dip, snus, or dissolvable tobacco products [such as Redman, Levi Garrett, Beechnut, Skoal, Skoal Bandits, Copenhagen, Camel Snus, Marlboro Snus, General Snus, Ariva, Stonewall, or Camel Orbs], not counting any electronic vapor products, on at least 1 day during the 30 days before the survey †M > F; 7th > 6th, 8th > 6th; H > W (Based on t-test analysis, p < 0.05.) All Hispanic students are included in the Hispanic category. All other races are non-Hispanic. Note: This graph contains weighted results. West Virginia - YRBS, 2017 - QN24
Percentage of Middle School Students Who Currently Smoked Cigars,* by Sex,† Grade,† and Race/Ethnicity, 2017 *Cigars, cigarillos, or little cigars, on at least 1 day during the 30 days before the survey †M > F; 7th > 6th, 8th > 6th (Based on t-test analysis, p < 0.05.) All Hispanic students are included in the Hispanic category. All other races are non-Hispanic. Note: This graph contains weighted results. West Virginia - YRBS, 2017 - QN25
Percentage of Middle School Students Who Currently Smoked Cigars,* 2001-2017† *Cigars, cigarillos, or little cigars, on at least 1 day during the 30 days before the survey †Decreased 2001-2017 [Based on linear and quadratic trend analyses using logistic regression models controlling for sex, race/ethnicity, and grade (p < 0.05). Significant linear trends (if present) across all available years are described first followed by linear changes in each segment of significant quadratic trends (if present).] Data not available for 2003, 2005. Note: This graph contains weighted results. West Virginia - YRBS, 2001-2017 - QN25
Percentage of Middle School Students Who Currently Smoked Cigarettes or Cigars,* by Sex,† Grade,† and Race/Ethnicity, 2017 *On at least 1 day during the 30 days before the survey †M > F; 7th > 6th, 8th > 6th (Based on t-test analysis, p < 0.05.) All Hispanic students are included in the Hispanic category. All other races are non-Hispanic. Note: This graph contains weighted results. West Virginia - YRBS, 2017 - QNTB2
Percentage of Middle School Students Who Currently Smoked Cigarettes or Cigars or Used Smokeless Tobacco,* by Sex,† Grade,† and Race/Ethnicity,† 2017 *On at least 1 day during the 30 days before the survey †M > F; 7th > 6th, 8th > 6th; H > W (Based on t-test analysis, p < 0.05.) All Hispanic students are included in the Hispanic category. All other races are non-Hispanic. Note: This graph contains weighted results. West Virginia - YRBS, 2017 - QNTB3
Percentage of Middle School Students Who Currently Smoked Cigarettes or Cigars or Used Smokeless Tobacco or Electronic Vapor Products,* by Sex,† Grade,† and Race/Ethnicity,† 2017 *On at least 1 day during the 30 days before the survey †M > F; 7th > 6th, 8th > 6th; H > W (Based on t-test analysis, p < 0.05.) All Hispanic students are included in the Hispanic category. All other races are non-Hispanic. Missing bar indicates fewer than 100 students in this subgroup. Note: This graph contains weighted results. West Virginia - YRBS, 2017 - QNTB4
Percentage of Middle School Students Who Ever Drank Alcohol,* by Sex, Grade,† and Race/Ethnicity, 2017 *Other than a few sips †7th > 6th, 8th > 6th (Based on t-test analysis, p < 0.05.) All Hispanic students are included in the Hispanic category. All other races are non-Hispanic. Note: This graph contains weighted results. West Virginia - YRBS, 2017 - QN26
Percentage of Middle School Students Who Ever Drank Alcohol,* 2001-2017† *Other than a few sips †Decreased 2001-2017, decreased 2001-2011, decreased 2011-2017 [Based on linear and quadratic trend analyses using logistic regression models controlling for sex, race/ethnicity, and grade (p < 0.05). Significant linear trends (if present) across all available years are described first followed by linear changes in each segment of significant quadratic trends (if present).] Data not available for 2003, 2005. Note: This graph contains weighted results. West Virginia - YRBS, 2001-2017 - QN26
Percentage of Middle School Students Who Drank Alcohol for the First Time Before Age 11 Years,* by Sex,† Grade, and Race/Ethnicity, 2017 *Other than a few sips †M > F (Based on t-test analysis, p < 0.05.) All Hispanic students are included in the Hispanic category. All other races are non-Hispanic. Missing bar indicates fewer than 100 students in this subgroup. Note: This graph contains weighted results. West Virginia - YRBS, 2017 - QN27
Percentage of Middle School Students Who Drank Alcohol for the First Time Before Age 11 Years,* 2007-2017† *Other than a few sips †Decreased 2007-2017, no change 2007-2011, decreased 2011-2017 [Based on linear and quadratic trend analyses using logistic regression models controlling for sex, race/ethnicity, and grade (p < 0.05). Significant linear trends (if present) across all available years are described first followed by linear changes in each segment of significant quadratic trends (if present).] Note: This graph contains weighted results. West Virginia - YRBS, 2007-2017 - QN27
Percentage of Middle School Students Who Ever Used Marijuana, by Sex,* Grade,* and Race/Ethnicity,* 2017 *M > F; 7th > 6th, 8th > 6th; B > W (Based on t-test analysis, p < 0.05.) All Hispanic students are included in the Hispanic category. All other races are non-Hispanic. Note: This graph contains weighted results. West Virginia - YRBS, 2017 - QN28
Percentage of Middle School Students Who Ever Used Marijuana, 2001-2017* *Decreased 2001-2017 [Based on linear and quadratic trend analyses using logistic regression models controlling for sex, race/ethnicity, and grade (p < 0.05). Significant linear trends (if present) across all available years are described first followed by linear changes in each segment of significant quadratic trends (if present).] Data not available for 2003, 2005. Note: This graph contains weighted results. West Virginia - YRBS, 2001-2017 - QN28
Percentage of Middle School Students Who Tried Marijuana for the First Time Before Age 11 Years, by Sex, Grade, and Race/Ethnicity,* 2017 *B > W (Based on t-test analysis, p < 0.05.) All Hispanic students are included in the Hispanic category. All other races are non-Hispanic. Note: This graph contains weighted results. West Virginia - YRBS, 2017 - QN29


