Agenda
210 likes | 225 Vues
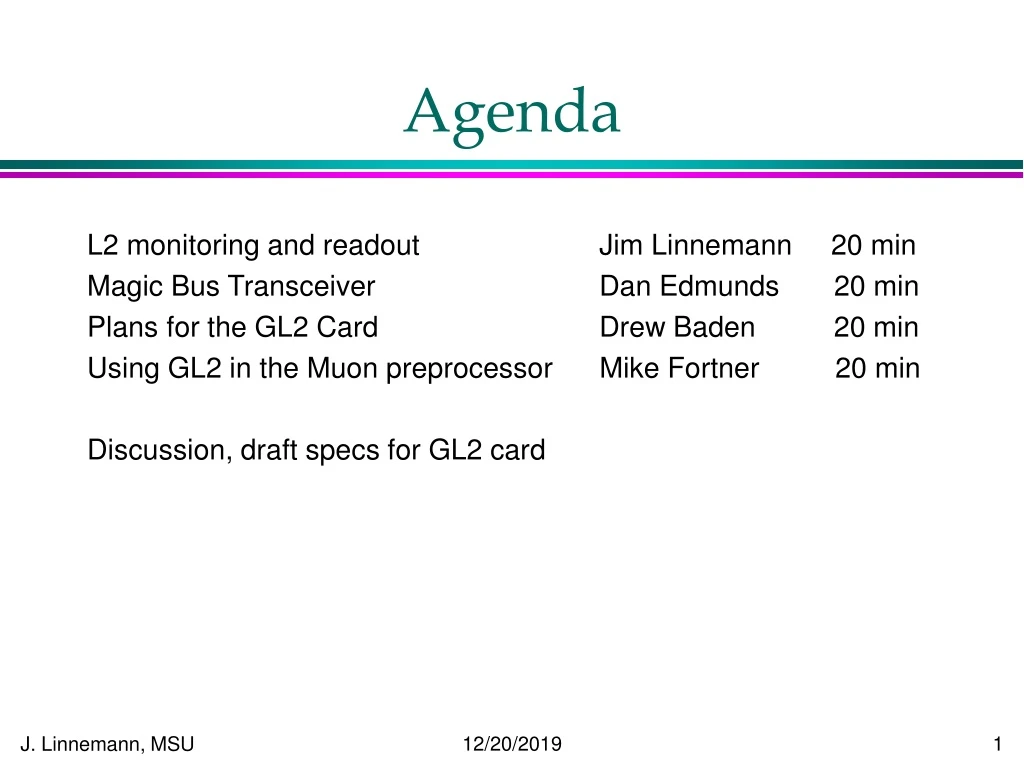
Agenda. L2 monitoring and readout Jim Linnemann 20 min Magic Bus Transceiver Dan Edmunds 20 min Plans for the GL2 Card Drew Baden 20 min Using GL2 in the Muon preprocessor Mike Fortner 20 min

Agenda
E N D
Presentation Transcript
Agenda L2 monitoring and readout Jim Linnemann 20 min Magic Bus Transceiver Dan Edmunds 20 min Plans for the GL2 Card Drew Baden 20 min Using GL2 in the Muon preprocessor Mike Fortner 20 min Discussion, draft specs for GL2 card
L2 I/O and Monitoring James T. Linnemann Michigan State University NIU Triggering Workshop October 18, 1997
Standard Preprocessor I/O • Inputs to processor(s) every (L1) event • possibly interleaved with event processing • Any Inter-processor handshakes, data movement, needed during event processing • Output to L2 Global every event • any data gathering needed (via VME?) • Output to L3 every event passed by Global • any data gathering needed (maybe just by VBD) • VME (or P3 VME) between processor and VBD • VBD siezes VME during L3 readout
Auxiliary I/O • Download of executable, constants • Once per Run • e.g. threshold of objects to send to L2Global • Once per Event: SCL Inputs (Queued) • Needed before processing: • Standard Qualifiers: Needed, Monitoring, Mark&Pass • Special Qualifiers: L1 bit-dependent hints (for speedup) • Needed after Processing: • L2 Pass/Fail from L2 HW FW
Monitoring I/O: Continuous and Periodic • Monitor every buffer in system by both methods • Pacman displays can come from either path • Continuous (132ns): L2FW Scaler Gates for Monitoring • internal state, number of buffers occupied • gives %, avg time in state; histogram of buffer occupancy • every 5 sec: Monitoring(and Error Messages?) • send to computer with D0IP to be served event # stamp to match • event counts: In, Out, Processed, Error • collected after processing event with Monitoring qualifier • buffer occupancy (right now) • circular buffer of processing times (for each state?) • distribution of times to see tails
More Exotic I/O Possibilities • Debugging: Halt/Examine/Step/Deposit • via Download path, or other means? • Resetting crate (=re-download?) • Incident logging (other than SCL)? • Event dump • Test data injection • helps standalone testing • > 16 events? Required? Full speed? • Playback
Summary of L2 I/O • Hardware Scaler lines (every buffer’s occupancy; state ID) • Every event: • L1 input • Test data injection • L2 Global Output • SCL: L1, L2 FW • L3 Output all passed events or just M+P? • Executable (and constants) • Cuts for run • Periodic monitoring block to server not via L3 • Event Dump, Debugger, Playback, Incident Log • Reset
I/O Paths • Dedicated Point to Point lines • VME • direct card to card • Multiport to another crate • Crate Interconnect • Ethernet/IP • Private Bus in crate (Mbus, PCI, P3...) • Shea/Goodwin? • [SCL and Data Cable]
VME I/O Issues • How many functions (safely) via VME? • I/O Latency during processing causing no deadtime? • fT = M (fB)2 / N; fB = (Rate X Size/ Bus Speed) fT =fract of time budget; fB = fract of bus capacity M = I/O per event; N = # (interruptible) fragments(VBD=1) • contributes to fractional variability of processing time (fB max) • quadratic dependence--be sure in control! • Drop L3 except Monitoring events (sep L1 bit) to help this? • L2G writing inputs to simplify engineering for preprocessors?
L2 I/O Card Issues • MBT card: • misc functions for L2 Global, L2 Cal: Mbus + possibly VME • GL2 Card: • misc functions for L2 mu, L2 tracking: VME • How many functions pushed onto MBT/GL2? • MBT is Mbus and possibly VME slave • How much commonality between MBT and GL2? • Can GL2 be used as L1 Cal driver?
What happens at first beam? • Deadtime is nonzero • look at which source of deadtime dominates • look at occupancy of L2 decision buffers and L3 readout buffers • whoever has full buffers in front has to react • If it’s L2, need details of internals of system • Global, or prepeprocessors? • Which preprocessor? • I/O or processing? • Average events or special cases causing problems?
Goals of Monitoring • Verify all events accounted for • how many data faults/errors • Document rejection/pass rates • Understand (for normal operation) • sources of deadtime • processing time for each element • loading of each of buffers within system • interaction of trigger setup and performance • where to expend tuning effort to improve performance • Assist in debugging in case of problems
Two kinds of monitoring • Information recorded by software • counters • current status information • recent history • Hardware Scalers • exact counts (e.g. events) • integral quantities (e.g. luminosity) • averages (e.g. livetime) • BOTH types captured periodically and sent to monitoring subsystem in host
L2 HW FW support • Counter with current number of events in L2 • = number in FE L2 decision buffers • decode into 0-15 and scale each: hist of # buffers in use • Similar scaling/decoding support available for other quantities from L2 • number of events in a given buffer • current state code of a processor • decode into fraction of time in each state • un-encoded objects also welcome; scalers flexible
L2 Global: Snapshots • Event counts, pass/fail by filter bit • Current number of events in • L2G input buffer • L2G output buffer • Input Receiver buffer (for each input line) • Circular buffers of start/stop times for each state • allows distributions, e.g. of processing time/event • L2 Cal captures similar information
L2 Global: Scalers • Current State Code: Update on state change. • Processing, idle, L3 Readout, etc. • Number of events in buffer: Update on event arrival, or end of event processing. • L2G input, L2G output, L2G receiver (each input), worst of L2G receivers (each MBT card) • L2 Cal captures similar information
What L2 scalers can do • Deadtime fraction • Time-in-state scalers can drive pac-man displays • <Time per event> = Fraction of time in “Processing” x Time / Nevts • Buffer-occupancy scalers can drive pac-man or bar-chart or calculate <N> • low buffer occupancy in front of an object means the bottleneck is elsewhere, or upstream of the buffer • Find mean occupancy, or fraction time > N buffers full • Color code on map of system
L1 HW FW:Monitoring Qualifier • Every 5 sec or so, L1 HW FW sets qualifier for L1-passed event • Capture L1 HW FW scalers after this event • L2 Preprocessors capture scalers after this event • should do this even if event is not fully processed • L2 Global captures scalers after this event • Capture L2 HW FW scalers after this event • Result: event-synchronous set of snaphots • event counts should sum perfectly • buffer counts not simultaneous (few 100 sesc) • Each passes information to Host (via TCC???)
What L2 Preprocessors should do • Capture snapshot for every “Monitoring” event • stamp with event number and report to host monitoring • and let that system combine pieces?) • or report to TCC (on request? Via VME?) • Snapshot: • Nin, Nbad, Nprocessed • Noccupied for each buffer type: in, (internal,) L3 • Circular buffer of processing times if time varies • Scalers: • Noccupied for each buffer • current state (or at least “processing/waiting” )
1.2 2.2 2.2 1.2 0.3 1.4 1.4 3.1 4.1 3.1 3.1 L2G Mu em jet
Global Administrator Worker State L3 In
