Download
1 / 20
200 likes | 228 Vues
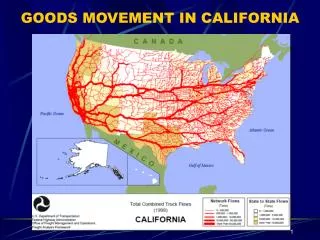
Self-Supporting Truckways: Closing the Gap in Financing Expanded Goods Movement By Robert W. Poole, Jr. and Peter Samuel. Decentralization of warehouses and industry (no rail sidings) Growth in just-in-time logistics (premium on speed and reliability)

E N D
Self-Supporting Truckways:Closing the Gap in Financing Expanded Goods MovementBy Robert W. Poole, Jr. and Peter Samuel
Decentralization of warehouses and industry (no rail sidings) Growth in just-in-time logistics (premium on speed and reliability) Short-medium distances uncompetitive for rail Projected increase in S. Calif rail mode-share from 22% to 37% by 2020 is highly unlikely. Trucks Will Remain the Mainstay of Goods-Movement
Inadequate highway capacity Increasing congestion Limited productivity gains Continued safety problems Diesel emission problems But Trucking Faces Serious Problems
From 1980 to 2000, VMT grew by 80%. From 1980 to 2000, lane-miles increased only 4%. Truck VMT is growing faster than car VMT. 46% of National Highway System will be at or over capacity by 2020. Inadequate Highway Infrastructure (national figures)
Severely congested (V/SF>.95) Interstates in 2001: Urban: 3,084 rt.-mi. Rural: 523 rt.-mi. Moderately congested Interstates (V/SF 0.8 to 0.95) in 2001: Urban: 2,392 rt.-mi. Rural: 1,299 rt.-mi. Interstates Becoming Congested
Rail labor productivity has increased four-fold since 1980. But in trucking, one driver still hauls (mostly) one trailer. Longer combination vehicles (LCVs) can more than twice as much freight as conventional 18-wheelers Truck shipping is $610 billion/year business; 10% saving is $61 billion Trucking Could Be Far More Productive
5,000 deaths/year from car-truck crashes. Highway safety groups against expanding territory of LCVs. Federal (1991) “LCV freeze” restricts use to western states and a few eastern turnpikes. Safety Issues Holding Up Change
Heavy-duty lanes designed for LCVs Built in existing right of way along freeways and Interstate routes Open (voluntarily) to all trucks; mandatory for LCVs in non-LCV states Self-funding from tolls, charged electronically Toll Truckways: a new approach
Two (14’) lanes each way Concrete jersey barrier separation Separate access/egress ramps Nodes (make-up/breakdown yards) Variable tolling, all-electronic Voluntary for conventional rigs, mandatory for LCVs Located in existing freeway corridors Key Urban Truckway Features
I-710,I-210, SR 60, I-10 among top 7 truck volumes nationally (2020) Trucks often 10% of traffic, 30% of capacity 4-lane truckway ports to I-15, 2-lane (+ passing lanes) I-15 to NV border Urban segment: 292 lane-mi., $8.1B Rural segment: 380 lane-mi., $2.0B Twin Ports to Nevada Truckway
Assume 3% annual truck traffic growth Medium-term urban: 50% of trucks @$1.00/mi (2004) average toll Medium-term rural: 60% of trucks @ $0.40/mi. (2004) average toll Results: both segments financially feasible (urban NPV = $17.7B, rural NPV = $6.2B) Analysis of Ports-Nevada Truckway
Link Port of Oakland to Silicon Valley and Stockton/Tracy 80% of Bay Area goods-movement is by truck 325 lane-miles, all 4-lane $11.9B construction cost (using SCAG figures) Oakland-Valleys Truckway
Truck traffic from federal FAF Medium-term: 60% of truck traffic $1.00/mile average toll (2004) Results: financially feasible (NPV of $14B vs. cost of $11.9B) Analysis of Oakland-Valleys Truckway
Provision of right of way in Interstate and freeway corridors (federal and stae) Liberalized size & weight limits on Toll Truckway lanes (federal and state) Removal of ban on Interstate tolling for Toll Truckway lanes (federal and state) State enabling legislation for tolling, regional joint powers authorities Needed Policy Changes
Increased goods-movement capacity, paid for by users Reductions in shipping costs Increased highway safety Reduced highway emissions Conclusion: toll truckways could be a win-win proposition