Download

1 / 12
120 likes | 210 Vues
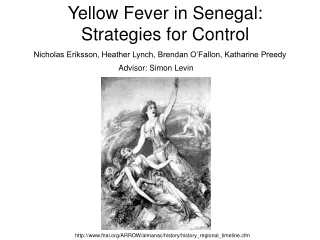
Explore effective strategies for tackling yellow fever in Senegal through vaccination tactics and quarantine measures. This model-based study examines the impact of different approaches on reducing infections, emphasizing the importance of urban settings. It suggests that targeted vaccination efforts can significantly curb outbreaks, and quarantine measures are also effective if properly implemented. Considerations for seasonal fluctuations, mosquito-based interventions, and pulsed vaccinations are highlighted for further research and implementation. The study provides insights into the dynamics of yellow fever transmission and identifies key factors influencing control measures.

E N D
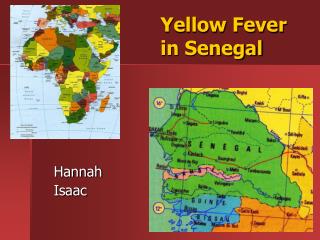
Yellow Fever in Senegal:Strategies for Control Nicholas Eriksson, Heather Lynch, Brendan O’Fallon, Katharine Preedy Advisor: Simon Levin http://www.fnai.org/ARROW/almanac/history/history_regional_timeline.cfm
World Health Organization: Communicable Diseases Epidemiological Report (2003)
Three patch model:Urban, Village, and Forest ~ 100,000 individuals with infection coming from contact with infected individuals from the village patch U V ~ 10,000 individuals with infection coming from contact with infected individuals from the forest patch F ~ 1,000 individuals with constant rate of infection from forest (monkey) reservoir
Urban Village Forest infection from the reservoir
rate of infection from reservoir = 0.0001/day transmission-rate = 0.12/infected individual/day recovery rate = 0.10/day contact probability between forest-village = 0.01/infected individual/day contact probability between village-urban = 0.01/infected individual/day birth rate = death rate = 0.0001/day Number of Infected Individuals Number of Infected Individuals ~ 2.3 years Time (days) Time (days)
Vaccination = + Fraction of Days Sampled vaccination rate = 2.5e-4 vaccinations/person/day Number of Infected Individuals
A Comparison of Vaccination Strategies Quarantine 50% Quarantine 75% Mean Urban Infected Individuals Vaccination Rate
Further Work: • Summary: • in this model, the most effective vaccination strategy is in the urban patch • quarantine can be as effective as vaccination if infected individuals can be properly identified • vaccination is most effective at the ‘tails’ of the infected distribution, i.e. it eliminates the worst outbreaks • pulsed vaccinations • seasonal fluctuations • mosquito population • mosquito-based control - spraying - mosquito nets • less parameter-sensitive models
Eigenvalues of Equilibrium Point of Homogeneous System Real part of eigenvalues Imaginary part of eigenvalues