Download

1 / 13
130 likes | 234 Vues
Explore the economic landscape of Poland in the 21st century, focusing on topics such as unemployment rates, foreign trade dynamics, inflation trends, GDP growth factors, and the national budget. Discover key factors influencing Poland's economy and its position in the European Union.

E N D
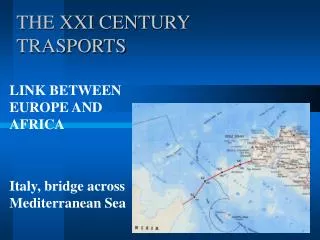
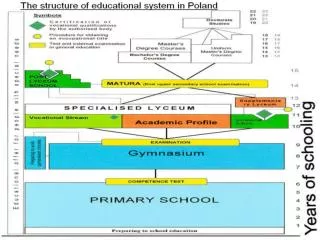
ECONOMICAL STRUCTURE OF POLAND IN THE XXI CENTURY ZESPÓŁ SZKÓŁ OGÓLNOKSZTAŁCĄCYCH NR 2 W PUŁAWACH IM. F..D. KNIAŹNINA STUDENTS UNDER THE SUPERVISION OF MGR GÓRECKA MARZENA
UNEMPLOYMENT AND UNEMPLOYMENT RATE BAEL unemployment rate and registered unemployment at the end of a quarter between 2005-2007 According to the BAEL data, in 2007 there were on average 1619 people unemployed in Poland which makes 9,6% of the total number people employed (in case of women the unemployment rate equaled 10,3%, men 9%). Comparing to year 2006 the number of unemployed decreased of 31%. According to the statistics of registered unemployment, at the end of 2007 there were 1,747 people out of work. The registered unemployment rate was 11,4% and it was 3,4 percentage points lower than in 2006.
UNEMPLOYMENT IN POLAND IN COMPARISON WITH EUROPEAN UNION COUNTRIES Unemployment in Poland is one of the highest in the European Union.
STRUCTURAL INCOMPATIBILITIES OF POLISH JOB MARKET • Structural incompatibilities occurring on the job market are connected with the following factors: • low level of capital of people especially among the people after the age of 35 • low level of the unemployed education • existence of klin podatkowy determining higher costs of labour in comparison to European Union countries • low spatial and occupational mobility of employees with worse qualifications. • Regional variation of job market Unemployment rate according to the level of education in years 2005-2007
POLISH FOREIGN TRADE POLISH TRADE DEFICIT IN 2007 -18,6 mld €
POLISH FOREIGN TRADE Shaping the Polish export dynamic from dollar perspective in comparison with an average export growth in this period (in %) In years 2000-2007 dynamic threefold export increase was observed up to the level of over 100mld euro (in 2000 the export value was 34,3mld euro). In the same period the import increased twice. The exchange of goods deficit which underwent systematical reduction from 18,7mld euro in 2000 to 9,7mld euro in 2005, in the last two years it deepened dynamically once again up to 18,6mld euro. Shaping the Polish dynamic from dollar perspective in comparison with an average import growth in this period (in %) The increase in the share of export relatively highly-processed products of electromechanical and chemical industry along with the decrease of light industry is observed. The increase of metallurgical products is observed.
INFLATION AND MONETARY POLICY Changes of prices of goods and services (in %) In the years 2002-2003 there was a very low level of inflation. In 2004 the growth of increase pace of prices connected with the former weaker value of zloty and as well as the influence of Poland joining European Union took place. In the following year there was inflation decrease and in 2006 prices of goods and services increase reached 1%. Inflation in Poland in comparison with UE in 2008 r.
GROSS DOMESTIC PRODUCT High economical growth of Poland in 2006 (6,2%) underwent the acceleration to 6,6% in 2007. It was the highest GDP growth from the beginning of decade. In 2007 as a result of high nominal income dynamic and strong demand for loans individual consumption increased by 5%. • The growth of consumption was caused by: • the improvement of the situation on the job market • salaries increase, valorization of social services • transfer of salary emigration • direct subsidies for farmers • increase of consumers moods concerning the future of households
FACTORS OF GROSS DOMESTIC PRODUCT GROWTH IN POLAND Growth of Gross Domestic Product in 2000-2007 in % The Polish economy is undergoing the growth in the main sectors (i.e services, industry, construction). The cause of this good condition of Polish economy is joining Poland to European Union. The increase of export was a stimulus of the growth of employment and consequently the increase of the national demand. In the beginning stage the growth of production resulted in the increase of investments what strengthened the increase of Gross Domestic Product.
POLISH BUDGET National budget can be defined as a financial statement of incomes and expenditures of a country within a certain period. It must be authorised by the parlament and the regional authorities. The parlament passes the resolution concerning the creation of the budget. In 2007 the budget incoms were higher than it had been planned before (3.2%). The expenditures of our country were carried out in 97,4%. As a result of the above facts the deficit was lower than it had been planned. In total it was 15, 9mld zł.
POLISH BUDGET IN 2007 POLISH BUDGET IN 2007 (IN THOUSANDS PLN) PLAN WYKONANIE INCOMES 228 952 516 236 367 532 EXPENDITURES 258 952 516 252 323 889 DEFICIT 30 000 000 15 956 357 We can observe a downward tendency of the budget deficit.