Download
1 / 70
700 likes | 723 Vues
Learn how to manage projects effectively using MS Project 2013. Track progress, enter actual costs, and utilize Earned Value Analysis for successful project execution. Workshop by Sandy Williams, a certified PMP with extensive project management experience. Discover process maturity and project closeout techniques. Mark your calendar for this essential chapter meeting!

E N D
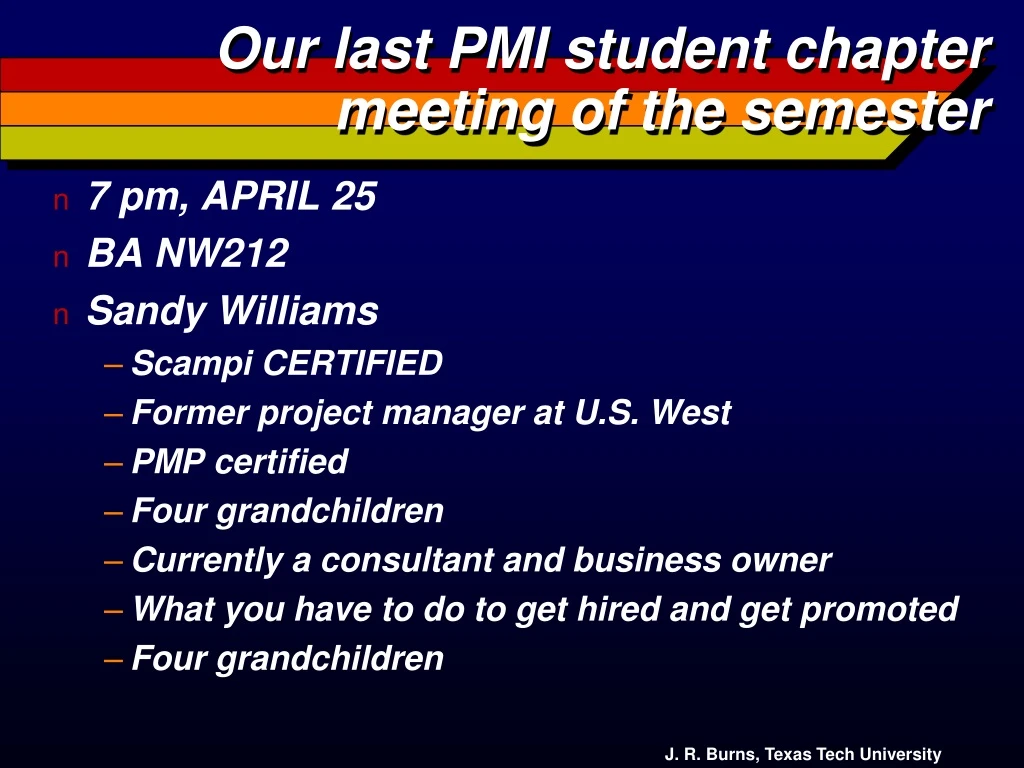
Our last PMI student chapter meeting of the semester • 7 pm, APRIL 25 • BA NW212 • Sandy Williams • Scampi CERTIFIED • Former project manager at U.S. West • PMP certified • Four grandchildren • Currently a consultant and business owner • What you have to do to get hired and get promoted • Four grandchildren
Using MS Project 2013 for Executing, Monitoring & Controlling • First, make certain your project plan is complete and final • Second, save it as a baseline • Begin entering actual information • Actual costs • Percentage complete
Tracking: MS Project will track— • Task start dates • Task finish dates • Task duration • Task cost work • Percentage of task that is complete
Getting Earned Value Data Visible • You can go to view and replace the entry table with the Earned Value table • Or, you can enter the earned value columns into your existing table through the Insert Column facility. • The columns are BCWP, BCWS, ACWP, CV, SC, SPI, CPI, etc. You can also request the Tracking Gantt Chart off the LHS side of MS Project There is also an Earned Value Report under Reports
First set Baseline and then Save it • Go to ‘Project’ tab • Click on Set Baseline and select ‘Set Baseline’ • Select ‘Entire project’, then click ‘OK’ • At this point you may need to set a Status Date. See EVA notes for doing this
Entering actual % Complete and start & Finish dates for a task • On the Gantt Chart view, select ‘View’ tab, click on ‘Tables’ and select ‘Tracking’ • Enter actual progress in the ‘% Comp’ column (Note: by default, MS Project 2013 considers cost to be independent of duration, Therefore, if the activity is not 100% complete, by default, MS Project will not let you override the actual cost. See notes as to how to fix this or read the next slide
To enter Actual Costs • You can change the table to the cost table • Or you can insert the actual cost column into the entry table • Click on File on the task bar • Then click on options • Then click on Schedule • Then uncheck “Actual costs are always calculated by Project” • Click OK
Indicating progress on a task as a percentage • In the task name field of the Gantt Chart • Double click—this brings up the task information sheet • Select the general tab • In the percentage complete box type a whole number between 0 and 100
Entering actual costs for a resource assignment • On the view menu, point to the Table, and click Tracking • Drag the divider bar to the right to view the Activity Cost field • In the activity cost field, type the actual cost for the assignment for which you want to update costs
Show the progress line: To do this........ • On the Gantt Chart view, right click on the Gantt Chart itself and select Progress Lines’. On the ‘Dates and Intervals’ tab, check ‘Display:’ and click ‘OK’.
It’s due Next Thursday, April 27.. Turn-in….. • Your tracking Gantt Chart with the progress line visible • Your Earned Value Table • Your Earned Value Report(s) • Discuss whether your project is ahead of or behind schedule, based on your EVA • Discuss whether your project is over or under budget, based on your EVA • IT IS DUE THURSDAY, April 27
Process Maturity and Project Closeout James R. Burns
To Follow up on Sandy Williams… • Before application of the CMMI • It was Chaos, Anarchy • The (U.S. West) organization was hooked on heroics • Afterwards, not so • People will resist change, especially when they have no buy-in to the vision of where the change will take us • Sometimes she had to use coercion -- in case of the engineers
Sandy is… • CMMI Scampi Assessor • Who decides what level (on a scale of 0 to 5) an organization is on? • Assessors and Appraisers How long does it take to go from one level to the next, say from a 3.4 to a 4.4? one year, usually
What does a ‘hero’ look like?? • He wears a T-shirt and tennis shoes • He lives off of pizza and diet coke • He is overweight • He comes in a 10 am….he leaves at 4 am the next morning • He loves showing off his designs, his code, his products
Maturity Models • Today, there are hundreds of Maturity models • They all measure maturity on a scale of 0 to 5 • Capability Maturity Model, CMM (1989) • Capability Maturity Model Integration, CMMI (2002) • Project Maturity Model, OPM3 • See pages 282--288 of Schwalbe, 8th Edition • Software Quality Function Deployment
Capability Maturity Model • Developed in preliminary form by Watts Humphries (published in a book he wrote that appeared in 1989) • Refined by the SEI (Software Engineering Institute) , a spin-off of Carnegie Mellon University in Pittsburgh • Known as the CMM • Discussed in Schwalbe, page 344-347 (approx)
Immature Software Organizations • Processes are ad hoc, and occasionally chaotic. • Processes are improvised by practitioners ON THE FLY. • Testing, reviews and walkthroughs usually curtailed under stress. • Quality is unpredictable.
Immature Software Organizations, Cont’d • Costs and schedules are usually exceeded. • Reactionary management is usually firefighting. • Success rides on individual talent and heroic effort. • Technology benefits are lost in the noise.
Mature Software Organizations • Processes are defined and documented. • Roles and responsibilities are clear. • Product and process are measured. • Processes and projects finish on time and within budget • Management has time to plan, monitor, and communicate.
Mature Software Organizations, Cont’d • Quality, costs, and schedules are predictable • Management is committed to continuous improvement. • Technology is used effectively within defined processes.
Software Process Definition • Project Planning • Project Management • Software Engineering Procedures • Software standards • Software Quality Evaluation • Software Configuration management
The Five Levels of Software Process Maturity • INITIAL • REPEATABLE • DEFINED • MANAGED • OPTIMIZING
Initial • Software processes are ad hoc, even chaotic • Software processes are ‘invented’ on the fly • The software processes are not defined • Success depends on individual effort • The environment is not stable
Initial, Continued • The benefits of software engineering practices are undermined • Planning is nonexistent or ineffective • Process capability is unpredictable because the software process is constantly changed or modified as the work progresses
Repeatable • Basic project management policies and procedures are established • Cost, schedule and functionality (scope) are tracked by module and task • A process discipline is put in place to repeat earlier successes • Managing new projects is based on experience with similar projects
Repeatable, Continued • Basic software management controls are installed • Estimations of cost and time to complete are based on history for similar projects • Problems are identified and documented • Software requirements are baselined (made tough to change)
Repeatable, Continued • Project standards are defined • Project teams work with their customers and subcontractors to establish stable, managed working environments • Process is under the control of a project management system that is driven by performance on previous projects • A project performance database is defined and populated
Defined • Software processes are documented • Software processes are standardized and integrated organization-wide • All projects use documented and approved versions of the organization’s processes of developing and maintaining software • A Software Engineering ProcessGroup (SEPG) is created to facilitate process definition and improvement efforts
Defined, Continued • Organization-wide training programs are implemented • Organization-wide standard software processes can be refined to encompass the unique characteristics of the project • A peer review process is used to enhance product quality • Process capability is stable and based on a common understanding of processes, roles, and responsibilities in a defined process
Managed • Quantitative quality goals are defined • Product quality and productivity are measured and collected • Both processes and products are quantitatively understood • Both processes and products are controlled using detailed measures • A productivity and quality database is defined
Managed, Continued • Projects achieve control by narrowing the variation in performance to within acceptable boundaries • Process variation is controlled by use of a strategic business plan that details which product lines to pursue • Risks associated with moving up the learning curve of a new application domain are known and carefully managed • Process capability is measured and operating within measurable limits
Optimizing • Continuous process improvement is enabled by quantitative feedback • Continuous process improvement is assessed from testing innovative ideas and technologies • Weak process elements are identified and strengthened • Defect prevention is explicit
Optimizing, Cont’d • Statistical evidence is available on process effectiveness • Innovations that exploit the best software engineering practices are identified • Improvement occurs from • INCREMENTAL ADVANCEMENTS IN EXISTING PROCESSES • INNOVATIONS USING NEW TECHNOLOGIES AND METHODS
How are firms doing?? • Many U.S. firms have reached the highest level, OPTIMIZING • Indian firms may be doing better
Organizational Project Management Maturity Model (OPM3) 1. Ad-Hoc: The project management process is described as disorganized, and occasionally even chaotic. The organization has not defined systems and processes, and project success depends on individual effort. There are chronic cost and schedule problems. 2. Abbreviated: There are some project management processes and systems in place to track cost, schedule, and scope. Project success is largely unpredictable and cost and schedule problems are common. 3. Organized: There are standardized, documented project management processes and systems that are integrated into the rest of the organization. Project success is more predictable, and cost and schedule performance is improved. 4. Managed: Management collects and uses detailed measures of the effectiveness of project management. Project success is more uniform, and cost and schedule performance conforms to plan. 5. Adaptive: Feedback from the project management process and from piloting innovative ideas and technologies enables continuous improvement. Project success is the norm, and cost and schedule performance is continuously improving.
Enter CMMI: Capability Maturity Model Integration • In 2007, the SEI asserted that it would no longer support the old SW-CMM. • On Dec 31, 2007 all SW-CMM appraisal results were expired • The purpose of the CMMI was to focus process maturity more towards project performance • Organizations must now upgrade to the CMMI • The CMMI is vastly improved over the CMM • Emphasis is on business needs, integration and institutionalization
CMMI Origins • The CMMI was derived from the • SW-CMM—capability maturity model for software • EIA/IS – electronic Industries Alliance Interim Standard • IPD-CMM—Capability Maturity Model for Integrated Product Development • CMMI architecture is open and designed to accommodate additional disciplines, like • CMMI-DEV – processes for development • CMMI-ACQ—processes required for supplier sourcing • CMMI-SVC—processes required for services
CMMI: cap mat model integration • Level 0: Incomplete • No goal. • Level 1: Performed • The process supports and enables achievement of the specific goals of the process area by transforming identifiable input work products to produce identifiable output work products. • Level 2: Managed • The process is institutionalized as a managed process. • Level 3: Defined • The process is institutionalized as a defined process. • Level 4: Quantitatively Managed • The process is institutionalized as a quantitatively managed process. • Level 5: Optimizing • The process is institutionalized as an optimizing process.
CMMI Staged Representation - 5 Maturity Levels Process performance continually improved through incremental and innovative technological improvements. Level 5 Optimizing Level 4 Quantitatively Managed Processes are controlled using statistical and other quantitative techniques. Process Maturity Level 3 Processes are well characterized and understood. Processes, standards, procedures, tools, etc. are defined at the organizational (Organization X )level. Proactive. Defined Level 2 Managed Processes are planned, documented, performed, monitored, and controlled at the project level. Often reactive. Level 1 Initial Processes are unpredictable, poorly controlled, reactive.
Information Technology Project Management, Eighth Edition Table 11-1. Project Management Maturity by Industry Group and Knowledge Area* KEY: 1 = LOWEST MATURITY RATING 5 = HIGHEST MATURITY RATING *Ibbs, C. William and Young Hoon Kwak. “Assessing Project Management Maturity,” Project Management Journal (March 2000).
Use of this tool has shown… • The Engineering and Construction Industries have a higher level of maturity than do the information systems and software development disciplines
Quality Function Deployment • Translates the “voice of the customer” into technical design requirements • Customer is King • Displays requirements in matrix diagrams • First matrix called “house of quality” • Series of connected houses
5 Importance Trade-off matrix 3 Design characteristics 4 2 1 Customer requirements Relationship matrix Competitive assessment 6 Target values Quality House
Competitive Assessment Customer Requirements 1 2 3 4 5 Presses quickly 9 B A X Removes wrinkles 8 AB X Doesn’t stick to fabric 6 X BA Provides enough steam 8 AB X Doesn’t spot fabric 6 X AB Doesn’t scorch fabric 9 A XB Heats quickly 6 X B A Automatic shut-off 3 ABX Quick cool-down 3 X A B Doesn’t break when dropped 5 AB X Doesn’t burn when touched 5 AB X Not too heavy 8 X A B Irons well Easy and safe to use
Energy needed to press Weight of iron Size of soleplate Thickness of soleplate Material used in soleplate Number of holes Size of holes Flow of water from holes Time required to reach 450º F Time to go from 450º to 100º Protective cover for soleplate Automatic shutoff Customer Requirements Presses quickly - - + + + - Removes wrinkles + + + + + Doesn’t stick to fabric - + + + + Provides enough steam + + + + Doesn’t spot fabric + - - - Doesn’t scorch fabric + + + - + Heats quickly - - + - Automatic shut-off + Quick cool-down - - + + Doesn’t break when dropped + + + + Doesn’t burn when touched + + + + Not too heavy + - - - + - Ironswell Easy and safe to use
- - Energy needed to press Weight of iron Size of soleplate Thickness of soleplate Material used in soleplate Number of holes Size of holes Flow of water from holes Time required to reach 450º Time to go from 450º to 100º Protective cover for soleplate Automatic shutoff + + +