Tile Commissioning Web System Overview & Analysis Tools
Explore equipment-oriented view & performance analysis of generated plots per run and module. Analyze DCS run performance, access results, & timeline visualization. Data provided by DCS and Oracle archive. Analysis tools include Glance and TileDCSDataGrabber. Use TCWS for efficient data retrieval and shifter support.

Tile Commissioning Web System Overview & Analysis Tools
E N D
Presentation Transcript
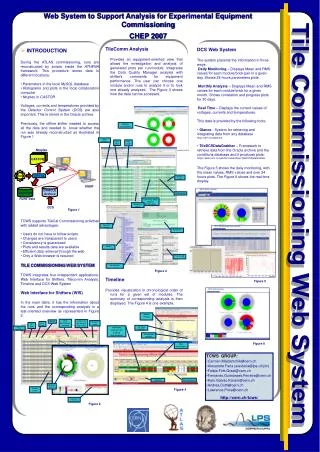
Ntuples CASTOR General Status plots Parameter Run Athena Status USER Plot related ORACLE Archive CommInfo Parameters Runs' data DCS Run performance overview Access to run analysis and results #Events Shifters name Run Date Run Type Run Number Modules Status Drawer sectors Detailed comments Web System to Support Analysis for Experimental Equipment Commissioning CHEP 2007 TileComm Analysis Provides an equipment-oriented view that allows the investigation and analysis of generated plots per run/module. Integrates the Data Quality Manager analysis with shifter's comments for equipment performance. The user can choose one module and/or runs to analyze it or to look one already analyzed. The Figure 3 shows how the data can be accessed. Timeline Provides visualization in chronological order of runs for a given set of modules. The summary of corresponding analysis is then displayed. The Figure 4 is one example. • DCS Web System • The system presents the information in three ways: • Daily Monitoring – Displays Mean and RMS values for each module/brick pair in a given day. Shows 24 hours parameters plots. • Monthly Analysis – Displays Mean and RMS values for each module/brick for a given month. Shows correlation and progress plots for 30 days. • Real Time – Displays the current values of voltages, currents and temperatures. • This data is provided by the following tools: • Glance - System for retrieving and integrating data from any databasehttp://cern.ch/atglance • TileDCSDataGrabber – Framework to retrieve data from the Oracle archive and the conditions database and it produces plots. https://twiki.cern.ch/twiki/bin/view/Atlas/TileDCSDataGrabber • The Figure 5 shows the daily monitoring, with the mean values, RMS values and over 24 hours plots. The Figure 6 shows the real time display. • INTRODUCTION • During the ATLAS commissioning, runs are reconstructed by scripts inside the ATHENA framework. This procedure stores data in different locations: • Parameters in the local MySQL database • Histograms and plots in the local collaboration computer • Ntuples in CASTOR • Voltages, currents and temperatures provided by the Detector Control System (DCS) are also important. This is stored in the Oracle archive. Previously, the offline shifter needed to access all the data and needed to know whether the run was already reconstructed as illustrated in Figure 1. • TCWS supports TileCal Commissioning activities with added advantages: • Users do not have to follow scripts • Changes are transparent to users • Consistency is guaranteed • Plots and results data are available • Efficient data retrieval through the web • Only a Web browser is required • TILE COMMISSIONING WEB SYSTEM • TCWS integrates four independent applications: Web Interface for Shifters, Tilecomm Analysis, Timeline and DCS Web System • Web Interface for Shifters (WIS) • In the main table, it has the information about the runs and the corresponding analysis in a test-oriented overview as represented in Figure 2. Modules visualization Run Number Run Type Run Date Shifters name DQM results Comments about modules performance Access to plots Figure 1 Tile Commissioning Web System Figure 3 Figure 5 Module selection Test type selection View/edit comment for module performance Time period selection Figure 6 Run information • TCWS GROUP: • Carmen.Maidantchik@cern.ch • Alexandre Faria (alexfaria@lps.ufrj.br) • Felipe.Fink.Grael@cern.ch • Fernando.Guimaraes.Ferreira@cern.ch • Kaio.Galvao.Karam@cern.ch • Andrea.Dotti@cern.ch • Lawrence.Price@cern.ch • http://cern.ch/tcws/ Mouse-over Legend Figure 4 Figure 2