Download
1 / 25
250 likes | 342 Vues
Introduces a novel BCCA for finding co-regulated gene subgroups, correlating gene expression patterns over conditions. Demonstrates the algorithm's effectiveness on various datasets and its application in determining common transcription factors.

E N D
Bi-correlation clustering algorithm for determining a set of co-regulated genes BIOINFORMATICSvol. 25 no.21 2009 Anindya Bhattacharya and Rajat K. De
Outline Introduction Bi-correlation clustering algorithm (BCCA) Results Conclusion
Introduction • Biclustering • Performs simultaneous grouping on genes and conditions of a dataset to determine subgroups of genes that exhibit similar behavior over a subset of experimental condition. • A new correlation-based biclustering algorithm called bi-correlation clustering algorithm (BCCA) • Produce a diverse set of biclusters of co-regulated genes • All the genes in a bicluster have a similar change of expression pattern over the subset of samples.
Introduction • Cluster analysis • Most cluster analysis try to find group of genes that remains co-expressed through all experimental conditions. • In reality , genes tends to be co-regulated and thus co-expressed under only a few experimental conditions.
Bi-correlation clustering algorithm • Notation • A set of n genes • Each gene has m expression values • For each gene gi there is an m-dimensional vector , there is the j-th expression value of gi. • A set of mmicroarry experiments (measurements) • n genes will have to be grouped into K overlapping biclusters
Bi-correlation clustering algorithm • Bicluster: • A bicluster can be defined as a subset of genes possesing a similar behavior over a subset of experiments • Represented as • A bicluster contains a subset of genes and a subset of experiments where each gene in is correlated with a correlation valued greater than or equal to specified threshold , with all other genes in over the measurements in .
Bi-correlation clustering algorithm • BCCA • Use person correlation coefficient for measuring similarity between expression patterns of two genes and .
Bi-correlation clustering algorithm • Step 1: • The set of biclusterS is initialized to NULL and number of biclusterBicount is initialized to 0 • Step 2A • BCCA generate a bicluster (C) for each pair of genes in a dataset under a set of conditions • For each pair of genes .BCCA creates a bicluster , where and .
Bi-correlation clustering algorithm • In step 2C: • For a pair of genes in C, if then a sample is detected from C, deletion of which caused maximum increase in correlation value between and . • If being a threshold, the sample is deleted from . otherwise, C is discarded. • Deletion of a measurement for which genes differ in expression value the most will result in the highest increase in correlation value. • BCCA deletes one measurement at a time from .
Bi-correlation clustering algorithm • In step 2D(a): • Other genes from , which satisfy the definition of a bicluster are included in C for its augmentation. • In step 2D(b): • Whether present biclusterC has been found. If it is so then we do not to include C, otherwise, C is considered as a new bicluster.
Results • Datasets • We demonstrate the affectiveness of BCCA in determining a set of co-regulated genes (i.e. the genes having common transcription factors) and functionally enriched clusters (and atributes) on five dataset
Results • Variation with respect to threshold • Plot of YCCD dataset :Average number of functionally enriched attributes (computed using P-values) versus correlation threshold value
Results • Follow a guideline on this value from a previous study by Allocco et al. (2004) which has concluded that if two genes have a correlation between their expression profiles >0.84 then therre is >50% chance of being bounded by a common transcription factor.
Results • By locating common transcription factors • At first, we only consider those biclusters that have less than or equal to 50 genes. • Use a software TOUCAN 2 (Aertset al., 2005) for performance comparison by extracting information on the number of transcription factors present in proximal promoters of all the genes in a single bicluster. • Presence of common transcription factors in the promoter regions of a set of genes is a good evidence toward co-regulation.
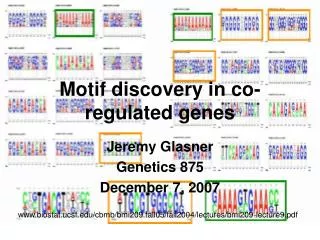
Sequences of all the five genes found in a bicluster generated by BCCA from SPTD dataset. Any transcription factor may be found present in more than one location in upstream region.
Results • Functional enrichment : • P-value • The functional enrichment of each GO category in each of the bicluster • employed the software Funcassociate (Berrizet al., 2003). • P-value represents the probability of observing the number of genes from a specific GO functional category within each cluster. • A low P-value indicates that the genes belonging to the enriched functional categories are biologically significant in the corresponding clusters.
Results • P-value of a functional category • Suppose we have total population of N genes , in which M has a particular annotation. • If we observe x genes with that annotation, in a sample of n genes, then we can calculate the probability of that observation. • The probability of seeing x or more genes with an annotation, out of n, given that M in the population of N have that annotation
Results • Only functional categories with are reported. • Analysis of the 10 biclusters obtained for the YCCD, the highly enriched category in biclusterBicluster1 is the ‘ribosome’ with P-value of
Conclusion • BCCA is able to find a group of genes that show similar pattern of variation in their expression profiles over a subset of measurements. • Better than other biclustering algorithm: • Find higher number of common transcription factors of a set of gene in a bicluster • More functionally enriched