Download

1 / 22
220 likes | 329 Vues
This research focuses on identifying differentially regulated genes within gene interaction networks through a novel Bayesian approach. By analyzing perturbation experiments, we distinguish between primarily and secondarily affected genes. The study employs a probabilistic Bayesian framework leveraging Markov Random Fields to estimate the likelihood of a gene's differential regulation status due to perturbations or inter-gene interactions. The method effectively categorizes genes into differentially expressed and equally expressed, enhancing our understanding of gene regulatory mechanisms.

E N D
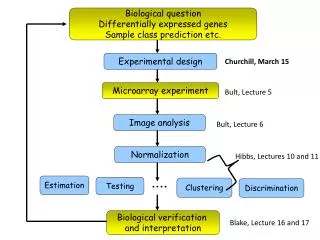
Identifying Differentially Regulated Genes Nirmalya Bandyopadhyay, Manas Somaiya, Sanjay Ranka, and Tamer Kahveci Bioinformatics Lab., CISE Department, University of Florida
Gene interaction through regulatory networks Gene networks: The genes are nodes and the interactions are directed edges. Neighbors incoming neighbors and outgoing neighbors. A gene can changes the state of other genes Activation Inhibition ERK K-Ras Raf MEK JNK RalGDS Ral RalBP1 Cob42Rac PLD1
Perturbation experiments Perturbation ERK K-Ras Raf MEK JNK Differentially expressed genes RalGDS Ral RalBP1 Cob42Rac PLD1 • In a perturbation experiment stimulant (radiation, toxic element, medication), also known as perturbation, is applied on tissues. • Gene expression is measured before and after the perturbation. • A gene can change its expression as a result of perturbation. • Differentially expressed gene (DE). • Equally expressed gene (EE).
Perturbation experiment : single dataset Perturbation Primarily affected genes ERK K-Ras Raf MEK JNK Secondarily affected genes RalGDS Ral RalBP1 Cob42Rac PLD1 • Primarily affected genes : Directly affected by perturbation. • Secondarily affected genes : Primarily affected genes affect some other genes.
Differentially and Equally regulated Differentially expressed • Some dataset inherently has two groups. • Fasting vs non-fasting, Caucasian American vs African American • For these datasets, a gene is • Differentially regulated: DE in one group and EE in another. • Equally regulated: DE or EE in both the groups. • Here, gene g1 is DE in data DA and EE in DB. Hence, it is DR. g2 g3 g3 g2 Equally expressed g1 g4 g5 g1 g4 g5 DB DA
Two datasets: Primary and secondary effects Primarily differentially expressed g0 g2 g3 g3 g2 Secondarily differentially expressed g1 g4 g5 g1 g4 g5 Equally expressed DB DA • Primarily differentially regulated genes (PDR): Directly affected by perturbation. • Secondarily differentially regulated genes (SDR): Primarily affected genes affect some other genes. 6 6
Problem & method • Input:Gene expression (control and non-control) of two data groups DA and DB. • Problem: Analyzing the primary and secondary affects of the perturbation • Estimate probability that a gene is differentially regulated because of the perturbation or because of the other genes (incoming neighbors)? • What are the primarily differentially regulated genes? • Method • Probabilistic Bayesian method, where we employ Markov Random Field to leverage domain knowledge.
Notation • Observed variables • Microarray datasets: • Two data groups: DA, DB • A single gene giin group C, (C ϵ A,B): • For All genes in group A: • Neighborhood variables • Hidden variables • State variables: • Regulation variables: Zi • Interaction variables: Xij
Problem formulation • Input to the problem: • Microarray expression: Y • Gene network V = {G, W} • G = {g0, g1, g2, …, gM} where g0 is metagene. • Goal: • Estimate the density p(Xij| X- Xij, Y, V, Wij = 1 ) for all Wij. This gene estimates the probability that a gene is DR due to the perturbation or due to an incoming neighbor gene. • Note: A higher value for p(Xij ={2, 3}| X- Xij, Y, V, Wij = 1 ) indicates a higher chance that gj is affected by gi
Bayesian distribution Likelihood density Prior density Posterior density • We propound a Bayesian model as it allows us to incorporate our beliefs into the model. • The joint probability distribution over X • We can derivate the density of Xij , p(Xij| X- Xij, Y, V, Wij =1) from the joint density function.
Prior density function : Markov random field g0 g2 g3 g3 g2 g1 g4 g5 g1 g4 g5 DA (a) Gene network DB X01 (2) X02 (1) X03 (1) X05 (3) X04 (4) X12 (5) X23 (1) X35 (3) X25 (7) X14 (8) X13 (5) (b) Markov random field • MRF is an undirected graph Ψ = (X, E). • X = {Xij} represents an edge in the gene network. • E = {(Xij, Xpj)| Wpi = Wij= 1} U {(Xij, Xik) | Wjk= Wij = 1} • An edge in MRF corresponds to two edges in the gene network. • (X23, X25) corresponds to (g2, g3) and (g3, g5)
Prior density function: Feature functions • Three beliefs relevant to our model: • In a data group, the meta gene g0 can affect the states of all other genes. (modeled by adding directed edges from g0 to all other genes.) • In a data group, a gene can affect the state of its outgoing neighbors. • A gene has high probability of being equally regulated. • We incorporate these beliefs into the MRF graph using seven feature functions. • Feature function: Unary or Binary function over the nodes of MRF. A feature function allows us to introduce our belief on the graph.
Feature Functions Left External Equality Right External Equality Left Internal Equality Right Internal Equality Feature functions • Unary: Capture the frequency of Xij. • Binary: Encapsulates the second belief that In a data group, a gene can affect the state of its outgoing neighbors. • Unary: Capture the third belief that a gene has high probability of being equally regulated. • Prior density function
Binary: External feature functions • The external feature functions encapsulate the belief that in a data group, a gene can affect the state of its outgoing neighbors. • Left Equality • Xij = Xpj Zi = Zp • Right Equality • Xij = Xik Zj = Zk g1 g2 g3 g4 (a) Gene network Right equality for X23 X12 X23 X13 X24 Left equality for X23 X34 (a) MRF network
Unary: Internal feature functions • The internal feature function represents the belief that a gene has high probability of being equally regulated. • gi is equally regulated. • Xij = {1,2,3,4} Zi = 1 (DE) • Xij = {13,14,15,15} Zi = 4 (EE) • gj is equally regulated. • Xij = {1,5,9,13} Zj = 1 (DE) • Xij = {4,8,12,16} Zj = 4 (EE)
Objective function optimization Differential evolution Obtain an initial estimate of state variables. Estimate parameters for likelihood density. Estimate parameters that maximize the prior density. Student’s t Estimate parameters that maximize the pseudo-likelihood density. Rank the DE genes based on the likelihood w.r.t the metagene. ICM
Dataset and experimental setup • DataSet • Real: Adapted from Smirnov et al. generated using 10 Gy ionizing radiation over immortalized B cells obtained from 155 doner. • Real/Synthetic: We created synthetic data to simulate the perturbation experiment based on the real dataset. The simulated model is taken from “Modeling of Multiple Valued Gene Regulatory Networks,” by Garg et. al. • Gene regulatory network: 24,663 genetic interactions over 2,335 genes collected from KEGG database. • Experimental setup • Implemented our method in MATLAB and java. • Ran our code on a quad core AMD Opteron 2 Ghz workstation with 32GB memory.
Comparison with other methods • We compared our method with three other methods: • SMRF: Our old method, developed to analyze the effect of external perturbation on a single data group. • SSEM: A method to differentiate between primary and secondary effect of perturbation on gene expression dataset. • Two sample t-test (Student’s t test)
Conclusions Our method could find primarily affected genes with high accuracy. It achieved significantly better accuracy than SMRF, SSEM and the student’s t test method. Our method produces a probability distribution rather than a fixed binary decision.
Acknowledgement This work was supported partially by NSF under grants CCF-0829867 and IIS-0845439.