Download
1 / 45
450 likes | 605 Vues
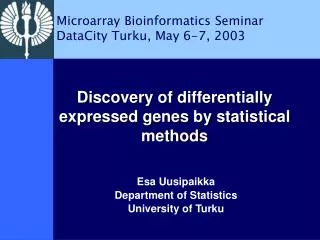
Microarray Bioinformatics Seminar DataCity Turku, May 6-7, 2003. Discovery of differentially expressed genes by statistical methods. Esa Uusipaikka Department of Statistics University of Turku. Molecular portraits and the family tree of cancer. Overview. 1. Statistical issues

E N D
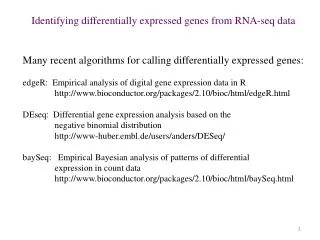
Microarray Bioinformatics Seminar DataCity Turku, May 6-7, 2003 Discovery of differentially expressed genes by statistical methods Esa Uusipaikka Department of Statistics University of Turku
Overview 1. Statistical issues 2. Design of experiment 3. ‘Low-level' analysis
Overview 4. ‘High-level' analysis - fold-change with fixed cutt-off - model for fold-change - standard statistical tests - permutation tests - multiple testing - False Discovery Rate (FDR) - time-series analysis
Statistical issues 1. Design of experiment 2. ‘Low-level' analysis data-cleaning
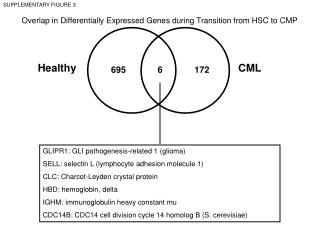
Statistical issues 3. ‘High-level' analysis 1. select differentially expressed (DE) genes 2. find groups of genes whose expression profiles can reliably classify the different RNA sources into meaningful groups
Experimental design Kerr, M. K., and Churchill, G. A. (2001). Experimental design for gene expression microarrays. Biostatistics 2, 183-201. Glonek, G. F. V., and Solomon, P. J. (2002). Factorial designs for microarray experiments. Technical Report, Department of Applied Mathematics, University of Adelaide, Australia. apply ideas from optimal experimental designs to suggest efficient designs for the some of the common microarray experiments
Experimental design Pan, W., Lin, J. and Le, C. (2002). How many replicates of arrays are required to detect gene expression changes in microarray experiments? A mixture model approach. Genome Biology 3(5): research0022.1-0022.10. considers sample size
Experimental design Speed, T. P., and Yang, Y. H. (2002). Direct versus indirect designs for cDNA microarray experiments. Technical Report 616, Department of Statistics, University of California, Berkeley. examines the efficiency of using a reference sample as against direct comparison
Experimental design It is not possible to give universal recommendations appropriate for all situations but the general principles of statistical experiment design apply to microarray experiments Churchill, G.A. Fundamentals of experimental design for cDNA microarrays. Nature Genet. 32, 490-495 (2002). Yang, Y.H. & Speed, T. Design issues for cDNA microarray experiments. Nature Rev. Genet. 3, 579-588 (2002).
Image Analysis and data-cleaning Yang, Y. H., Buckley, M. J., Dudoit, S., and Speed, T. P. (2002). Comparison of methods for image analysis on cDNA microarray data. Journal of Computational and Graphical Statistics 11, 108-136. compare various segmentation and background estimation methods
Image Analysis and data-cleaning Kerr, M. K., Martin, M., and Churchill, G. A. (2000). Analysis of variance for gene expression microarray data. Journal of Computational Biology 7, 819-837. and Wolfinger, R. D., Gibson, G., Wolfinger, E. D., Bennett, L., Hamadeh, H., Bushel, P., Afshari, C., and Paules, R. S. (2001). Assessing gene significance from cDNA microarray expression data via mixed models. Journal of Computational Biology 8, 625-637. have proposed the use of ANOVA models for normalization
Image Analysis and data-cleaning Quackenbush, J. Microarray data normalization and transformation. Nature Genet. 32, 496-501 (2002).
Selecting differentially expressed genes 1. simply generating the data is not enough; one must be able to extract from it meaningful information about the system being studied 2. there is no one-size-fits-all solution for the analysis and interpretation of genome-wide expression data
Selecting differentially expressed genes 3. statistical methods for interpreting the data have proliferated 4. there are now so many options available that choosing among them is challenging 5. understanding of both the biology and the computational methods is essential for tackling the associated ‘data mining’ tasks
Selecting differentially expressed genes One of the core goals of microarray data analysis is to identify which of the genes show good evidence of being DE. This goal has two parts. 1. The first is select a statistic which will rank the genes in order of evidence for differential expression, from strongest to weakest evidence. 2. The second is to choose a critical-value for the ranking statistic above which any value is considered to be significant.
k-fold change 1. measure of differential expression by theratio of expression levelsbetween two samples 2. genes withratios above a fixed cut-off kthat is, those whose expression underwent a k-fold change, were said to be differentially expressed 3. this test isnot a statistical test, and there is no associated value that can indicate the level of confidence in the designation of genes as differentially expressed or not differentially expressed
k-fold change 4. replicationis essential in experimental design because it allows anestimate of variability 5. ability to assess such variability allowsidentification of biologically reproducible changesin gene expression levels
Model for fold-change 1. model that accounts for random, array- and probe-specificnoise 2. evaluation of whether the 90% confidence interval for each gene’s fold-change excludes 1.0 3. this method incorporates available information about variability in the gene-expression measurements 4. can suffer when the data set is either too small or too heterogeneous 5. data-derived estimates of variation
Model for fold-change Li, C. & Hung Wong, W. Model-based analysis of oligonucleotide arrays: model validation, design issues and standard error application. Genome Biol. 2, research0032 (2001). Roberts, C.J. et al. Signaling and circuitry of multiple MAPK pathways revealed by a matrix of global gene expression profiles. Science 287, 873-880 (2000). Ideker, T., Thorsson, V., Siegel, A.F. & Hood, L.E. Testing for differentially expressed genes by maximum-likelihood analysis of microarray data. J. Comput. Biol. 7, 805-817 (2000).
Standard statistical tests 1. More typically, researchers now rely on variants of common statistical tests. 2. These generally involve two parts: calculating a test statistic and determining the significance of the observed statistic. 3. A standard statistical test for detecting significant change between repeated measurements of a variable in two groups is the t-test; 4. this can be generalized to multiple groups via the ANOVA F statistic.
Standard statistical tests variations on the t-test statistic (often called ‘t-like tests’) for microarray analysis are abundant Tusher, V.G., Tibshirani, R. & Chu, G. Significance analysis of microarrays applied to the ionizing radiation response. Proc. Natl Acad. Sci. USA 98, 5116-5121 (2001). Golub, T.R. et al. Molecular classification of cancer: class discovery and class prediction by gene expression monitoring. Science 286, 531-537 (1999). Model, F., Adorjan, P., Olek, A. & Piepenbrock, C. Feature selection for DNA methylation based cancer classification. Bioinformatics 17 Suppl 1, S157-S164 (2001).
Standard statistical tests 1. use of non-parametric rank-based statistics is also common, via both traditional statistical methods and 2. ad hocones designed specifically for microarray data Zhan, F. et al. Global gene expression profiling of multiple myeloma, monoclonal gammopathy of undetermined significance, and normal bone marrow plasma cells. Blood 99, 1745-1757 (2002). Ben-Dor, A., Friedman, N. & Yakhini, Z. Scoring genes for relevance. Technical Report 2000-38 (Institute of Computer Science, Hebrew University, Jerusalem, 2000). Park, P.J., Pagano, M. & Bonetti, M. A nonparametric scoring algorithm for identifying informative genes from microarray data. Pac. Symp. Biocomput. 52-63 (2001).
Standard statistical tests 1. For most practical cases, computing a standard t or F statistic is appropriate, although referring to the t or F distributions to determine significance is often not. 2. The main hazard in using such methods occurs when there are too few replicates to obtain an accurate estimate of experimental variances. In such cases, modeling methods that use pooled variance estimates may be helpful.
Standard statistical tests Xiangqin Cui and Gary A Churchill (2003). Statistical tests for differential expression in cDNA microarrayexperiments. Genome Biology 4(4): 210.1-210.10.
Standard statistical tests 1. Regardless of the test statistic used, one must determine its significance 2. Standard interpretations of t-like tests assume that the data are sampled from normal populations with equal variances 3. Expression data may fail to satisfy either or both of these constraints
Standard statistical tests 4. Although log transformation can improve normality and help equalize variances, ultimately the best estimates of the data’s distribution come from the data themselves Quackenbush, J. Microarray data normalization and transformation. Nature Genet. 32, 496-501 (2002).
Permutation tests Permutation tests, generally carried out by repeatedly scrambling the samples’ class labels and computing t statistics for all genes in the scrambled data, best capture the unknown structure of the data. Tusher, V.G., Tibshirani, R. & Chu, G. Significance analysis of microarrays applied to the ionizing radiation response. Proc. Natl Acad. Sci. USA 98, 5116-5121 (2001). Golub, T.R. et al. Molecular classification of cancer: class discovery and class prediction by gene expression monitoring. Science 286, 531-537 (1999). Dudoit, S., Yang, Y.-H., Callow, M.J. & Speed, T.P. Statistical methods for identifying differentially expressed genes in replicated cDNA microarray experiments. Technical Report 578 (Department of Statistics, University of California at Berkeley, Berkeley, CA, 2000).
Permutation tests Such permutation tests are ideal when the number of arrays is sufficient to offer the desired degree of confidence.
Multiple testing 1. One advantage of permutation methods is that they allow more reliable correction formultiple testing. 2. The issue of multiple tests is crucial, as microarrays typically monitor the expression levels of thousands of genes. 3. Standard Bonferroni correction (that is, multiplying the uncorrected p-value by the number of genes tested) is overly restrictive.
Multiple testing 1. Step-down methods designed to minimize this overcorrection are little better for thousands of genes. 2. Both methods are overly strict because they are based on the assumption that each gene represents an independent test. 3. In fact, the correlation structure between gene-expression patterns is significant and complex. Holm, S. A simple sequentially rejective multiple test procedure. Scand. J. Stat. 6, 65-70 (1979).
Multiple testing To capture this structure, Dudoit et al. propose a permutation-based approximation of Westfall and Young’s method Dudoit, S., Yang, Y.-H., Callow, M.J. & Speed, T.P. Statistical methods for identifying differentially expressed genes in replicated cDNA microarray experiments. Technical Report 578 (Department of Statistics, University of California at Berkeley, Berkeley, CA, 2000). C code is available online http://www.cbil.upenn.edu/tpWY
Multiple testing A package of R functions for other techniques evaluated in Dudoit et al is available at http://www.stat.berkeley.edu/users/terry/ zarray/Software/smacode.html
Multiple testing The advantage of permutation-based adjustment for multiple testing. The x-axis shows unadjusted p-values derived from independent t tests for each gene to detect differential expression between sensitive and resistant cell lines. The y-axis shows the adjusted p-values using Bonferroni correction (black circles) and Westfall and Young’s permutation-based method (blue squares). At the adjusted cutoff of 0.05, the permutation method finds 11 significantly changing genes (instead of 7 without permutation).
False discovery rate 1. All these approaches focus on determining the ‘family-wise error rate,’ the overall chance that at least one gene is incorrectly identified as differentially expressed. 2. For microarray studies focusing on finding sets of predictive genes, it may instead be acceptable to bound the ‘false discovery rate’ (FDR), the probability that a given gene identified as differentially expressed is a false positive.
False discovery rate 3. A simple method for bounding the FDR is proposed by Benjamini and Hochberg. 4. While this, too, assumes that each gene is an independent test, a permutation-based approximation of this method is implemented in the SAM (Significance Analysis of Microarrays) program by Tusher et al. Benjamini, Y. & Hochberg, Y.Controlling the false discovery rate: a practical and powerful approach to multiple testing.J. Roy. Stat. Soc. B 57, 289-300 (1995). Tusher, V.G., Tibshirani, R. & Chu, G. Significance analysis of microarrays applied to the ionizing radiation response. Proc. Natl Acad. Sci. USA 98, 5116-5121 (2001).
False discovery rate Efron, B., Storey, J. & Tibshirani, R. Microarrays, Empirical Bayes Methods, and False Discovery Rates. (2001). Storey, J., Taylor, J. & Siegmund, D.Strong Control, Conservative Point Estimation, and Simultaneous Conservative Consistency of False Discovery Rates: A Unified Approach.(2003).
Comparison of SAM to conventional methods for analyzing microarrays Falsely significant genes plotted against number of genes called significant. Of the 57 genes most highly ranked by the fold change method, 5 were included among the 46 genes most highly ranked by SAM. Of the 38 genes most highly ranked by the pairwise fold change method, 11 were included among the 46 genes most highly ranked by SAM. These results were consistent with the FDR of SAM compared to the FDRs of the fold change and pairwise fold change methods.
False discovery rate 5. A more permissive permutation- based approach to bounding the FDR appears in the Whitehead’s GeneCluster software package. Golub, T.R. et al. Molecular classification of cancer: class discovery and class prediction by gene expression monitoring. Science 286, 531-537 (1999).
False discovery rate Although in some data sets even the lowest FDR may be prohibitively high, this can be a valuable approach to finding some valid leads when more stringent analyses find none.
Time series analysis 1. The canonical time-series data in the field come from two experiments following the yeast cell cycle. 2. Spellman’s analysis incorporates a Fourier transform to test the periodicity of individual genes in three separate data sets, before combining these into a single significance score used to rank the genes. Cho, R.J. et al. A genome-wide transcriptional analysis of the mitotic cell cycle. Mol. Cell 2, 65-73 (1998). Spellman, P.T. et al. Comprehensive identification of cell cycle-regulated genes of the yeast Saccharomyces cerevisiae by microarray hybridization. Mol. Biol. Cell 9, 3273-3297 (1998).
Time series analysis 3. Later analyses of the same data sets look at other time-warping or phase-shifting algorithms to test periodicity. 4. Software for several of these is available online. Aach, J. & Church, G.M. Aligning gene expression time series with time warping algorithms. Bioinformatics 17, 495-508 (2001). Filkov, V., Skiena, S. & Zhi, J. Analysis techniques for microarray time-series data. J. Comput. Biol. 9, 317-330 (2002).
Time series analysis 5. Evaluating or modifying time-series analysis methods for the microarray domain, particularly given the difficulty of taking sufficiently frequent array measurements to monitor many processes of interest, is an area ripe for additional attention. 6. Also of interest is the suitability of such methods for analysis of samples related in other ways, such as cells exposed to different doses of a drug, or expression patterns from related bacterial strains.
Other Approaches - Bayes/ Posterior odds (Newton et al.) - Bayesian networks (Friedman et al.) - Empirical bayes (Tibshirani) - Support Vector (Brown et al.) • Mixed model (MacKay & Miskin) - Parametric bootstrap (van der Laan & Bryan)
Slonim, D.K. From patterns to pathways: gene expression data analysis comes of age.Nature Genet. 32, 502-508 (2002). Churchill, G.A. Fundamentals of experimental design for cDNA microarrays. Nature Genet. 32, 490-495 (2002). Yang, Y.H. & Speed, T. Design issues for cDNA microarray experiments. Nature Rev. Genet. 3, 579-588 (2002). Quackenbush, J. Microarray data normalization and transformation. Nature Genet. 32, 496-501 (2002). Sources