Analyzing Microarray Data: Techniques and Tools for Gene Expression Studies
310 likes | 429 Vues
This guide covers the essential steps for analyzing microarray data, focusing on identifying differentially expressed genes for biological question resolution. It includes experimental design principles, data normalization methods like RMA, and practical analysis using software tools. Through the discussion of gene lists and biological verification, we explore clustering, discrimination, and interpretation methods. Resources for data acquisition, such as GEO, and useful scripts for R are provided, enhancing understanding of analysis from raw data to insightful output.

Analyzing Microarray Data: Techniques and Tools for Gene Expression Studies
E N D
Presentation Transcript
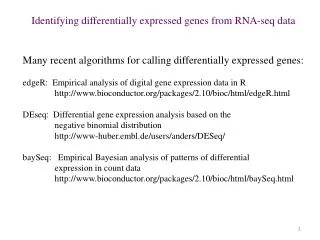
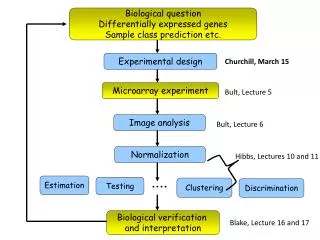
Biological question Differentially expressed genes Sample class prediction etc. Experimental design Churchill, March 15 Microarray experiment Bult, Lecture 5 Image analysis Bult, Lecture 6 Normalization Hibbs, Lectures 10 and 11 Estimation Testing Clustering Discrimination Biological verification and interpretation Blake, Lecture 16 and 17
Project Steps • Find and Download Array Data • Normalize Array Data • Analyze Data • i.e., generate gene lists • Differentially expressed genes, genes in clusters, etc. • Interpret Gene Lists • Use the annotations of genes in your lists • Gene Ontology terms are available for many organisms, but not all
Getting The Data • Search GEO (or whatever) for a data set of interest. • Download the data files • e.g., Affy .CEL files, Affy .CDF files, etc. • Upload to home directory
Normalize the Data • Sent you all a script (2/23/2012) to RMA normalize the Ackerman array data available from my home directory
library(affy) library(makecdfenv) Array.CDF=make.cdf.env(“MoGene-1_0-st-v1.cdf”) CELData=ReadAffy() CELData@cdfName=“Array.CDF” rma.CELData = rma(CELData) rma.expr = exprs(rma.CELData) rma.expr.df = data.frame(ProbeID=row.names(rma.expr),rma.expr) write.table(rma.expr.df,"rma.expr.dat",sep="\t",row=F,quote=F)
What is a library? • What does the ReadAffy() function do?What are possible arguments for the ReadAffy() function? • What class of R object is rma.CELData? • What class of R object is rma.expr? • What class of R object is rma.expr.df?
slotNames(CELData) • phenoData(CELData)
Plotting summarized probeset intensities across the Ackerman arrays….(non normalized) jpeg("boxplot.jpeg") boxplot(CELData, names=CELData$sample, col="blue") dev.off()
Plotting summarized probeset intensities across the Ackerman arrays….(normalized) mydata=rma.expr.df jpeg("normal_boxplot.jpg") boxplot(mydata[-1], main = "Normalized Intensities", xlab="Array", ylab="Intensities", col="blue") dev.off()
Next time • Posted articles from Gary Churchill. • If you only read one article, read Churchill 2004 • See also Gary’s web site: • http://churchill.jax.org/software/rmaanova.shtml • Look at Sample Data and Tutorial • After that lecture we will begin analysis of microarray data • MAANOVA
Cost Throughput Gigabases Cost per Kb Lucinda Fulton, The Genome Center at Washington University
Sequencing Technologies http://www.geospiza.com/finchtalk/uploaded_images/plates-and-slides-718301.png
Sequence “Space” • Roche 454 – Flow space • Measure pyrophosphate released by a nucleotide when it is added to a growing DNA chain • Flow space describes sequence in terms of these base incorporations • http://www.youtube.com/watch?v=bFNjxKHP8Jc • AB SOLiD – Color space • Sequencing by DNA ligation via synthetic DNA molecules that contain two nested known bases with a flouorescent dye • Each base sequenced twice • http://www.youtube.com/watch?v=nlvyF8bFDwM&feature=related • Illumina/Solexa – Base space • Single base extentions of fluorescent-labeled nucleotides with protected 3 ‘ OH groups • Sequencing via cycles of base addition/detection followed deprotection of the 3’ OH • http://www.youtube.com/watch?v=77r5p8IBwJk&feature=related • GenomeTV – Next Generation Sequencing (lecture) • http://www.youtube.com/watch?v=g0vGrNjpyA8&feature=related http://finchtalk.geospiza.com/2008/03/color-space-flow-space-sequence-space_23.html
“Standard” File formats Sequence containers FASTA FASTQ BAM/SAM Alignments BAM/SAM MAF Annotation BED GFF/GTF/GFF3 WIG Variation VCF GVF
Tools Alignments BLAST: not for NGS BWA Bowtie Maq … Transcriptomics Tophat Cufflinks … Variant calling ssahaSNP Mosaic … Counting (Chip-Seq, etc) FindPeaks PeakSeq
FASTQ: Data Format • FASTQ • Text based • Encodes sequence calls and quality scores with ASCII characters • Stores minimal information about the sequence read • 4 lines per sequence • Line 1: begins with @; followed by sequence identifier and optional description • Line 2: the sequence • Line 3: begins with the “+” and is followed by sequence identifiers and description (both are optional) • Line 4: encoding of quality scores for the sequence in line 2 • References/Documentation • http://maq.sourceforge.net/fastq.shtml • Cock et al. (2009). Nuc Acids Res 38:1767-1771.
FASTQ Example For analysis, it may be necessary to convert to the Sanger form of FASTQ…For example, Illumina stores quality scores ranging from 0-62; Sanger quality scores range from 0-93. Solexa quality scores have to be converted to PHRED quality scores. • FASTQ example from: Cock et al. (2009). Nuc Acids Res 38:1767-1771.
SAM (Sequence Alignment/Map) • It may not be necessary to align reads from scratch…you can instead use existing alignments in SAM format • SAM is the output of aligners that map reads to a reference genome • Tab delimited w/ header section and alignment section • Header sections begin with @ (are optional) • Alignment section has 11 mandatory fields • BAM is the binary format of SAM http://samtools.sourceforge.net/
Mandatory Alignment Fields http://samtools.sourceforge.net/SAM1.pdf
Alignment Examples Alignments in SAM format http://samtools.sourceforge.net/SAM1.pdf
Valid BED files chr1 86114265 86116346 nsv433165 chr2 1841774 1846089 nsv433166 chr16 2950446 2955264 nsv433167 chr17 14350387 14351933 nsv433168 chr17 32831694 32832761 nsv433169 chr17 32831694 32832761 nsv433170 chr18 61880550 61881930 nsv433171 chr1 16759829 16778548 chr1:21667704 270866 - chr1 16763194 16784844 chr1:146691804 407277 + chr1 16763194 16784844 chr1:144004664 408925 - chr1 16763194 16779513 chr1:142857141 291416 - chr1 16763194 16779513 chr1:143522082 293473 - chr1 16763194 16778548 chr1:146844175 284555 - chr1 16763194 16778548 chr1:147006260 284948 - chr1 16763411 16784844 chr1:144747517 405362 +
Galaxy See Tutorial 1 http://main.g2.bx.psu.edu/ Build and share data and analysis workflows No programming experience required Strong and growing development and user community
Dialog/Parameter Selection History Tools
Tutorial Web Site http://www.ncbi.nlm.nih.gov/staff/church/GenomeAnalysis/index.shtml Tutorial 5
RNA Seq Workflow • Convert data to FASTQ • Upload files to Galaxy • Quality Control • Throw out low quality sequence reads, etc. • Map reads to a reference genome • Many algorithms available • Trade off between speed and sensitivity • Data summarization • Associating alignments with genome annotations • Counts • Data Visualization • Statistical Analysis
Typical RNA_Seq Project Work Flow Tissue Sample Total RNA mRNA cDNA Sequencing FASTQ file QC TopHat Cufflinks Gene/Transcript/Exon Expression Visualization Statistical Analysis JAX Computational Sciences Service
TopHat http://tophat.cbcb.umd.edu/ TopHat is a good tool for aligning RNA Seq data compared to other aligners (Maq, BWA) because it takes splicing into account during the alignment process. Figure from: Trapnell et al. (2010). Nature Biotechnology 28:511-515. Trapnell et al. (2009). Bioinformatics 25:1105-1111.
TopHat is built on the Bowtie alignment algorithm. Trapnell C et al. Bioinformatics 2009;25:1105-1111
Cufflinks http://cufflinks.cbcb.umd.edu/ • Assembles transcripts, • Estimates their abundances, and • Tests for differential expression and regulation in RNA-Seq samples Trapnell et al. (2010). Nature Biotechnology 28:511-515.