Searching for Differentially Expressed Genes
470 likes | 576 Vues
Searching for Differentially Expressed Genes. Eva Budinská Bioinformatics Conference on Genomics and Proteomics Data Analysis 25-27.11.2009 Brno, Czech Republic. Biological/medical researcher. We need you to find the differentially expressed genes in our dataset. Euh???. External HDD.

Searching for Differentially Expressed Genes
E N D
Presentation Transcript
Searching for Differentially Expressed Genes Eva Budinská Bioinformatics Conference on Genomics and Proteomics Data Analysis 25-27.11.2009 Brno, Czech Republic
Biological/medical researcher We need you to find the differentially expressed genes in our dataset... Euh??? External HDD Data analyst
Searching for differentially expressed genes • WHAT is it a differentially expressed gene?
Searching for differentially expressed genes • WHAT is it a differentially expressed gene? • WHY should we search it?
Searching for differentially expressed genes • WHAT is it a differentially expressed gene? • WHY should we search it? • WHEREcan we search for it?
Searching for differentially expressed genes • WHAT is it a differentially expressed gene? • WHY should we search it? • WHEREcan we search for it? • HOW to find it?
Searching for differentially expressed genes • WHAT is it a differentially expressed gene? • WHY should we search it? • WHEREcan we search for it? • HOW to find it? • (WHO should do that?, WHY me!...)
Searching for differentially expressed genes • WHAT is it a differentially expressed gene? • WHY should we search it? • WHERE can we search for it? • HOW to find it? • (WHO should do that?, WHY me!...)
mRNA Protein DNA WHAT is an expressed gene? • gene expression • a gene is expressed when it is being transcribed into mRNA • if a gene is expressed, we say it is active • we can measure the gene expression by the amount of mRNA transcription ~ expression translation
mRNA mRNA DNA DNA WHAT is a differentially expressed gene? • differentially expressed gene • compare two samples • in one sample is expressed MORE than in the other Healthy colon tissue Colon cancer tissue
Searching for differentially expressed genes • WHAT is it a differentially expressed gene? • WHY should we search it? • WHERE can we search for it? • HOW to find it? • (WHO should do that?, WHY me!...)
WHY should we search for it? • In MEDICINE To understand • the mechanism of diseases: DISEASE / HEALTHY TISSUE • why some patients do respond to the therapy and some do not: RESPONDERS / NON-RESPONDERS new therapeutical targets, optimized therapy and prevention • In BIOLOGY To study • mechanisms of adaptation (bacteria in extreme conditions, parasites in host organism, ...) • ...
Searching for differentially expressed genes • WHAT is it a differentially expressed gene? • WHY should we search it? • WHEREcan we search for it? • HOW to find it? • (WHO should do that?, WHY me!...)
WHERE can we search for it? • we can measure the gene expression by the amount of mRNA • mRNA can be extracted from cells of any living organism • In medicine • tissues/organs • extracted tumors, nodes • blood • bone marrow • In biology • extracting mRNA from bacteria • tissues of plants • tissues/organs
Searching for differentially expressed genes • WHAT is it a differentially expressed gene? • WHY should we search it? • WHERE can we search for it? • HOW to find it? • (WHO should do that?, WHY me!...)
HOW can we find differentially expressed genes? • Exploring gene by gene • RT-PCR • FISH OR • Thousands of genes in one experiment • Microarrays
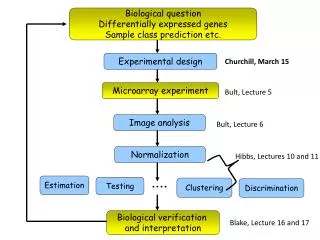
Microarrays Quantify the pixel intensity of each gene in each channel (green, red) ~ Numbers equivalent to the amount of mRNA ~ gene activity ~ gene expression gene microarrays
HOW can we find a differentially expressed gene? A. Healthy colon tissue B. Colon cancer tissue mRNA mRNA > DNA DNA 9/3 = 3 FOLD CHANGE A gene is 3 times more expressed in colon cancer than in healthy colon tissue
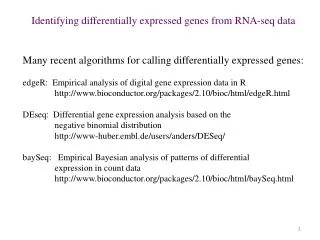
HOW can we find differentially expressed genes?METHODS • Fold change rules • Hypothesis testing • Regression strategies
HOW can we find differentially expressed genes?METHODS • Fold change rules • Hypothesis testing • Regression strategies
Fold change rules • All genes that have 2 fold change in expression (both directions) are considered differentially expressed between the two samples • Why to do it: • EASY • Why NOT: • Smaller changes can be biologically significant! (the small effects can be multiplied inside a group of genes from the same pathway) • The data come with biological and technical variability: • What about 1.9? • The fold-changes can be biased to zero (mix of tumor and normal cells) • No assessment of statisticalsignificance Statistical testing
HOW can we find differentially expressed genes?METHODS • Fold change rules • Hypothesis testing • Regression strategies
Hypothesis testing I. • Is the mean expression of a gene in group A different from the mean expression in group B? • Conduct a statistical test for each gene g = 1, . . . ,m, giving test statistics Tg and corresponding p-values • Choosing a statistical test Number of groups to compare 2 >2 Data have Gaussian distribution Data have Gaussian distribution YES NO YES NO T-test Mann-Whitney test ANOVA Kruskal-Wallis test
Hypothesis testing II. • Two–sample T-test can be used to test equality of the group means μ1, μ2. • The p-valuepg - is the probability that the test statisticunder the null hypothesis (here: μ1= μ2) is at least as extreme as the observed value Tg. Under the null hypothesis, Pr(Tg≤T) = pg. variability
Multiple hypothesis testing problem Thousands of genes on microarray slide Thousands of hypotheses are testedsimultaneously Increased chance of false positives Example: 10 000 genes on a chip, no differentially expressed => 0.05 x 10 000 = 500with p-value < 0.05. p–values <0.05 do not correspond to significantfindings anymore We need to ADJUST for this multiple testing problem
Adjustment for multiple hypothesis testing problem • Type I. error rates • Family–wise error rate (FWER): The probability of at least one Type I error (false positive):FWER = Pr(FP > 0) • False discovery rate (FDR)(Benjamini & Hochberg,1995): • The expected proportion of False positives among all positives.
Adjusting p-values • Controlling the Family Wise Error Rate (FWER) • Bonferroni correction (for independent testings) p < a / m (e.g. p < 0.05/10 000) • Controlling the False Discovery Rate (FDR) • Benjamini/Hochberg procedure Ordered unadjusted p–values: P(1),..., P(m) To control FDR at level a, For a given α, find the largest k such that Reject the hypotheses Hjfor j = 1, . . . , k. FDR = 10% (from 100 rejected hypotheses we can expect 10 false positives)
Adjustment for multiple hypothesis testing problem • FWER if we want ALL selected genes to be significant. However, many differentially expressed genes may not appear significant • FDR if we prefer to pick up the majority of differentially expressed genes and do not care about some false positives.
Significance analysis of microarrays - (2001 by Tusher, Tibshirani and Chu) - Permutation algorithm for False discovery rate (FDR) estimation. - Based on modified t-statistic: - Statistical significance of observed score di is subsequently assessed with permutation of original data and calculating expected score de (d score distribution). - Gene is considered statistically significant when satisfying |di - de | > Δ. - Advantage: easy to use, methodologically simple - Disadvantage: computationally intensive, high memory requirements tuning constant (adjustment for variability in data)
Significance analysis of microarrays - A gene is considered statistically significant when satisfying |di - de| > Δ. di de
Volcano plots II. - log10(q-value) ~ -log10(0.1)=2.3
HOW can we find differentially expressed genes?METHODS • Fold change rules • Hypothesis testing • Regression strategies
Regression strategies • When have more than 1 variable that can affect the gene expression • gene expression ~ group + age + gender Linear modelling • We try to find out how much the gene expression changes when the value of some continuous variable changes • gene expression ~ overall survival • gene expression ~ age Linear modelling, Cox proportional hazards model • We want to find the probability that the sample belongs to a certain group given the expression level of a gene. Logistic regression
Searching for differentially expressed genes Number of groups to compare continuous response variable >2 2 Linear models, Cox proportional hazards models (survival times) Data have Gaussian distribution Data have Gaussian distribution NO YES NO YES ANOVA, Linear models, SAM Number of factors Mann-Whitney test, SAM Kruskal-Wallis test, SAM >1 1 T-test, Linear models, SAM Linear models
What to do with a list of differentially expressed genes? • Ad-hoc pathway analysis • Clustering genes in order to determine the groups of genes • Clustering samples for control purposes • Compare to other datasets (meta-analysis)
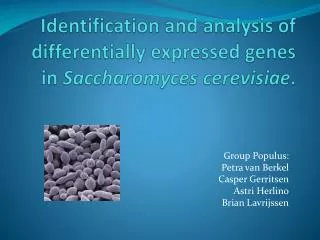
Microsatellite instability (MSI) in colon cancer • MSI tumors are characteristic by: • observed in ~15 % of sporadic colon cancers • high microsatellite instability • due to mismatch repair gene epigenetic silencing (hypermethylation of MSH1, MSH2, MSH6) • increased immune response • infiltration of tumor epithelium by T-lymphocytes • HLA class increased expression • better survival
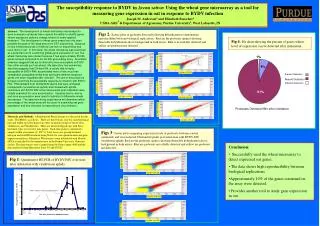
Differential gene-expression analysis of MSI vs. MSS • Aim: • Find MSI gene expression signatures stable across different datasets • We have analyzed 3 publicly available datasets • Affymetrix HG-U133_Plus_2(54675 probesets) • Analysis: • Significance analysis of microarrays SEPARATELY on each of the datasets • Compared lists of differentially expressed genes on FDR = 10% • Significant genes in ALL THREE DATASETS were inserted into KEGG pathway analysis
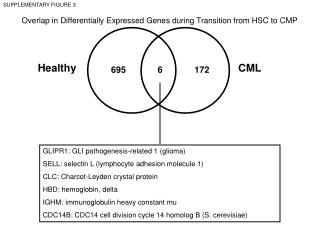
SAM results GSE 13067 GSE 4554 GSE 13294 685 differentially expressed genes in all three datasets at FDR<=10%
TOP 15 DOWN-regulated genes in MSI (significant in all 3 datasets) Gene Symbol Gene Title GSE4554 GSE13067 GSE13294 adj.p.val logFCH adj.p.val logFCH adj.p.val logFCH TNNC2 troponin C type 2 (fast) 0.003 -1.01 0.003 -0.49 0.000 -1.12 7A5 metastasis associated in colon cancer 1 0.000 -1.33 0.019 -1.32 0.000 -1.54 ZMYND8 zinc finger, MYND-type containing 8 0.003 -0.88 0.000 -1.04 0.000 -0.98 RNF43 ring finger protein 43 0.007 -0.91 0.000 -1.60 0.000 -1.30 SYT7 synaptotagmin VII 0.306 -0.49 0.065 -0.40 0.000 -0.86 TSPAN6 tetraspanin 6 0.007 -0.93 0.000 -1.50 0.000 -1.01 ASCL2 achaete-scute complex homolog 2 0.002 -1.30 0.001 -1.90 0.000 -1.87 TDGF1 teratocarcinoma-derived growth factor 1 0.000 -1.87 0.000 -2.61 0.000 -2.32 ATP9A ATPase, class II, type 9A 0.000 -1.20 0.000 -1.40 0.000 -1.19 GABRE GABA A receptor, epsilon 0.062 -0.70 0.022 -0.89 0.000 -1.25 PROX1 prospero homeobox 1 0.004 -1.11 0.021 -1.15 0.000 -1.23 VIL1 villin 1 0.034 -0.76 0.057 -0.55 0.000 -1.09 NOX1 NADPH oxidase 1 0.014 -1.17 0.001 -2.44 0.000 -2.03 PLAGL2 pleiomorphic adenoma gene-like 2 0.007 -0.91 0.000 -1.49 0.000 -0.88 A1CF APOBEC1 complementation factor 0.160 -0.52 0.002 -1.18 0.000 -1.27
TOP 15 UP-regulated genes in MSI (significant in all 3 datasets) Gene Symbol Gene Title GSE4554 GSE13067 GSE13294 adj.p.val logFCH adj.p.val logFCH adj.p.val logFCH KDELR3 Homo sapiens KDEL endoplasmic reticulum protein 0.002 1.01 0.000 0.90 0.000 0.90 TRIB2 tribbles homolog 2 (Drosophila) 0.000 1.33 0.000 1.41 0.000 1.69 TFAP2A Homo sapiens AP-2 gene for transcription factor AP-2 0.000 1.52 0.000 2.35 0.000 1.78 TRIM7 tripartite motif-containing 7 0.000 2.46 0.000 1.55 0.000 2.01 KCNK1 potassium channel, subfamily K, member 1 0.041 0.79 0.002 1.33 0.000 0.86 CTSE cathepsin E 0.077 0.96 0.043 1.53 0.000 1.18 CATSPERB cation channel, sperm-associated, beta 0.151 0.55 0.109 0.27 0.000 1.03 DUSP4 dual specificity phosphatase 4 0.000 1.90 0.000 2.73 0.000 1.83 CCDC68 coiled-coil domain containing 68 0.030 0.76 0.002 1.17 0.000 1.29 LSMD1 LSM domain containing 1 0.001 1.03 0.000 1.00 0.000 0.86 SECTM1 secreted and transmembrane 1 0.006 0.94 0.105 0.59 0.000 1.30 LMO4 LIM domain only 4 0.018 0.75 0.001 1.03 0.000 0.79 CD55 Homo sapiens decay accelerating factor for complement (CD55, Cromer bloodgroup system) (DAF) gene, complete cds. 0.024 0.85 0.029 0.94 0.000 1.28 SPATA18 spermatogenesis associated 18 homolog (rat) 0.022 0.92 0.007 1.22 0.000 0.96 RPL22L1 ribosomal protein L22-like 1 0.000 1.32 0.000 1.80 0.000 1.68
Immune response in MSI • MSI-H associated with the higher frequency of activated tumour infiltrating lymphocytes
ROCK2 TGF- signaling pathway • Inhibition of TGF- growth suppression in MSI tumors results from the frequent frameshift mutation of TGFBR2 • In MSS tumors by mutation/loss of SMAD4