Understanding Differentially Expressed Genes in Microarray Studies: Concepts and Techniques
340 likes | 457 Vues
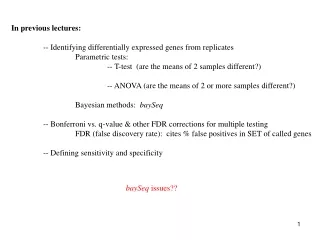
This lecture explores the identification and significance of differentially expressed sets of genes in microarray experiments. We discuss the importance of selecting genes for validation, conducting follow-up experiments, and integrating Gene Ontology (GO) terms to interpret expression data. The lecture emphasizes how various sets of genes can provide insights into biological processes and pathways, aiding in understanding gene functions and annotations. We also address statistical methods for evaluating these gene sets while considering issues like multiple testing.

Understanding Differentially Expressed Genes in Microarray Studies: Concepts and Techniques
E N D
Presentation Transcript
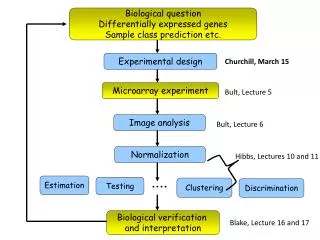
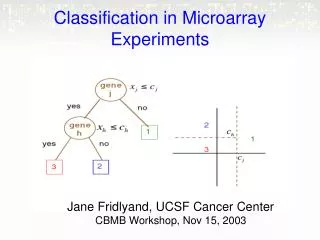
Identifying differentially expressed sets of genes in microarray experiments Lecture 23, Statistics 246, April 15, 2004
A cartoon version of microarrays List of differentially expressed genes Long list of d.e. genes
Long lists of d.e. genes biological understanding What happens next? • Select some genes for validation? • Do follow-up experiments on some genes? • Publish a huge table with the results? • Try to learn about all the genes on the list (read 100s of papers)? • …. Usually, some or all of the above will be done, and more. Can we help further at this
Sets of genes There are usually many sets of genes that might be of interest in a given microarray experiment. Examples include genes in biological (e.g. biochemical, metabolic, and signalling) pathways, genes associated with a particular location in the cell, or genes having a particular function or being involved in a particular process. We could even include sets of genes for which all of the preceding are unknown, but we have reason believe could be of interest, typically from previous experiments. In thinking like this, it is important to remember that many genes (that is, their protein products) can have multiple functions, or be involved in many processes, etc. There are many databases (EcoCyc, KEGG,..) of pathways, and it is not my intention to review them here. We will focus on the most important related concept: the GO.
The Gene Ontology Consortium Ashburner et al. Nature Genetics 25: 25-29. http://www.geneontology.org The goal of the Gene Ontology TM (GO) Consortium is to produce a controlled vocabulary that can be applied to all organisms even as knowledge of gene and protein roles in cells is accumulating and changing. GO provides three structured networks of defined terms to describe gene product attributes Molecular Function Ontology (7304 terms as of April 5, 2004):the tasks performed by individual gene products; examples are carbohydrate binding and ATPase activity Biological Process Ontology (8517 terms) broad biological goals, such as mitosis or purine metabolism, that are accomplished by ordered assemblies of molecular functions Cellular Component Ontology (1394 terms)subcellular structures, locations, and macromolecular complexes; examples include nucleus,telomere, and origin recognition complex
From the GO web site. The path back to each ontology from a gene. We will call each term in a path a split.
Structure of a GO annotation Each gene can have several annotated GOs and each GO can have several splits. E.g. DNA topoisomerase II alpha has 8 GO annotations and 11 splits
Annotation of genes to a node in the ontology Each node is also connected to many other related nodes.
Are sets of genes differentially expressed? The sets we refer to here are all the outcomes of analyses. Later we discuss sets specified a priori. Examples of sets. They could be the list of all genes whose differential expression (e.g. average M-value) exceeds a given threshold, typically a liberal one, which would not correspond to any real “significance”, e.g. 1.5-fold. They might be clusters. What do we mean by a set being differentially expressed. Here it is a convenient shorthand for being unusual in relation to all the genes represented on the array, for example, by being functionally enriched, in the sense of having more genes of a given category than one would expect, by chance.
GO and microarray gene sets Hypothesis: Functionally related, differentially expressed genes should accumulate in the corresponding GO-group. Problem: to find a method which scores accumulation of differential gene expression in a node of the GO. We describe the calculation from the program Gostat. For all the genes analysed, it determines the annotated GO terms and all splits. It then counts the # of appearances of each GO term for the genes in the set, as well as the # in the reference set, which is typically all genes on the array. Then a 22 table is formed, see over page, and a p-value calculated.
51 416 467 125 8588 8713 173 9177 9004 Is a GO term is specific for a set? Contingency Table P-value count genes with GO term in set 8x10-52 count genes without GO term in set count in set (e.g. differentially expressed genes) Count in reference set (e.g. all genes on array) Fisher's exact test or chi-square test
The multiple testing problem Naturally one doesn’t test a single GO term or split, but many, perhaps 1000s. As with testing of single genes, we need to deal with the multiple testing problem. Many of the solutions from there carry over: Bonferroni, Holm, step-down minP, FDR, and so on. But there are also special problems here, deriving from the nesting relationships between splits. In my view, these are not easily dealt with, and require more research. Related questions. How can we compare the results of different lists being compared? And, rather than select a set of genes using a cut-off, can we make use the gene abundances or p-values for differential expression?
GOstat: Tool for finding significant GO terms in a list of geneshttp://gostat.wehi.edu.au
There are many similar tools Here are a few. GenMAPP, and MAPPFinder EASE (DAVID) FunSpec FatiGO …..
Outline of MAPPfinder: MAPP = MicroArray Pathway Profiler
Analyzing microarray data by functional gene sets defined a priori Analysis at the level of single gene: • Identifying differentially expressed genes becomes a challenge when the magnitude of differential expression is small. • For some differences, many genes are involved. Analysis at the level of functional group: why? By incorporating biological knowledge, we can hope to detect modest but coordinate expression changes of sets of functionally related genes.
PGC-1-responsive genes involved in oxidative phosphorylation are coordinately downregulated in human diabetes Mootha et al, Nature Genetics July 2003 Data: Affymetrix microarray data on 22,000 genes in skeletal muscle biopsy samples from 43 males, 17 with normal glucose tolerance (NGT), 8 with impaired glucose tolerance and 18 with Type 2 diabetes (DM2). In their single gene analysis, a t-statistic was calculated for each gene. No significant difference found between NTG and DM2 after adjusting for multiple testing. Their idea: test 149 a priori defined gene sets for association with disease phenotypes.
149 gene sets Sets of metabolic pathways: • manually curated pathways (standard textbook literature reviews, and LocusLink) • Netaffx annotations using GenMAPP metabolic pathways Sets of coregulated genes: • SOM clustering of the mouse expression atlas
Two sample Kolmogorov-Smirnov test To compare two empirical cdfs, SM(x) and SN(x) based on samples of size M and N, resp, the Kolmogorov-Smirnov (K-S) test uses the K-S distance DMN = maxx|SM(x) - SN(x)|. This is normalized by multiplying by (M-1 + N-1). It has a complicated null distribution, which can be approximated by permuting.
From Mootha et al ES=enrichment score for each gene = scaled K-S dist A set called OXPHOS got the largest ES score, with p=0.029 on 1,000 permutations.
OXPHOS Other (A small difference for many genes) All genes OXPHOS
Simplification Mootha et al did a two sample K-S test to compare genes in a specific gene set with genes not in that set. Instead of doing this, why don’t we simply do a one sample test, comparing each gene set to the whole (population) directly? Each gene set is small w.r.t. the entire set of genes, so all other genes ≈ all genes. If we have approximate normality, a z-test should work for shift alternatives. A chi-squared test for scale changes also works.
One sample z-test Assumption: the (population of) t-statistics of all genes follow normal distribution. Denote the mean by and the SD by . If this is the case, the best test of the null hypothesis that a sample t1 , t2, …..,tn is from this distribution, with alternative a shift of the original distribution is based on t . Specifically, it uses z = ( t - )/ / n . In general, we’d expect =0 and =1, and this is the case for Mootha’s ts. Thus we test the null hypothesis that our sample comes from the same population using z = n t . Let’s do a normal qq-plot of the 149 z-statistics of this form.
Mootha’s data Normal qq-plot of n x t OXPHOS
Result from one sample z-test • OXPHOS is easily identified as -10. • The next three sets on the top ranking list are all related to oxidative phosphorylation.
Simulation 1 • 1500 29 gene expression values are generated from N(0,1), representing 1500 genes for 9 cases and 20 controls. • The 1500 genes are divided into 50 gene sets, each with 30 genes. The genes are correlated within each gene set. • We manipulate the gene expression level of the cases of the first gene set so that the magnitude of difference is known.
Conclusion • When the population follows a normal distribution, the one-sample z-test is most powerful for shift alternatives (no surprise: theory says it has to be). • From the simulation study, the one sample z-test is seen to be more powerful than the two sample K-S test for shift alternatives (even less of a surprise). • The new method is not as compute intensive as the K-S test. • Similar results can be given for the following test statistic, for scale change alternatives: for a set of n genes z’ = i=1,..n [(ti - t)2 - (n-1)] / (2(n-1)). (A test of no scale change might locate a set of genes that was split, with some having larger and others having smaller ts than average.)
Acknowledgements Tim Beissbarth Yun Zhou Karen Vranizan