Estimating FDR in Gene Expression Experiments using Bayesian Model
Learn how Bayesian Mixture Models are used to estimate False Discovery Rate (FDR) in multi-class gene expression experiments, with a focus on the breast cancer dataset by Hedenfalk et al.

Estimating FDR in Gene Expression Experiments using Bayesian Model
E N D
Presentation Transcript
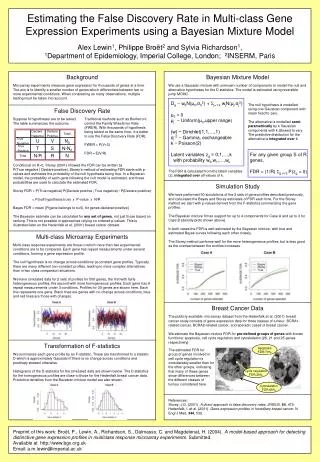
Declare Negative Declare Positive Total True Negative U V N0 True Positive N-N0 T S Total N-R R N Apoptosis FDR:70% Cycle regulation FDR:26% Cytoskeleton FDR:66% Estimating the False Discovery Rate in Multi-class Gene Expression Experiments using a Bayesian Mixture Model Alex Lewin1, Philippe Broët2 and Sylvia Richardson1, 1Department of Epidemiology, Imperial College, London; 2INSERM, Paris Background Bayesian Mixture Model Microarray experiments measure gene expression for thousands of genes at a time. The aim is to identify a smaller number of genes which differentiate between two or more experimental conditions. When considering so many observations, multiple testing must be taken into account. We use a Gaussian mixture with unknown number of components to model the null and alternative hypotheses for the D statistics. The model is estimated using reversible jump MCMC. Dg~ w0N(μ0,σ02) + j=1:kwjN(μj,σj2) μ0 = 0 μj ~ Uniform(μ0,upper range) {w} ~ Dirichlet(1,1,…,1) σj-2 ~ Gamma, exchangeable k ~ Poisson(2) Latent variables zg = 0,1,…,k with probability w0,w1,…,wk The null hypothesis is modelled using one Gaussian component with mean fixed to zero. The alternative is modelled semi-parametrically by k Gaussian components with k allowed to vary. The predictive distribution for the alternative is integrated over k. False Discovery Rate Suppose N hypotheses are to be tested. The table summarizes the outcome. Traditional methods such as Bonferroni control the Family Wise Error Rate (FWER). With thousands of hypothesis being tested at the same time, it is better to use the False Discovery Rate (FDR). FWER = P(V>0) FDR = E(V/R) For any given group S of R genes, FDR = (1/R) g in S P(zg = 0) Conditional on R>0, Storey (2001) showed the FDR can be written as P(True negative | Declare positive). Storey’s method of estimating FDR starts with p-values and estimates the probability of the null hypothesis being true. In a Bayesian model, the probability of each gene following the null model is estimated, and these probabilities are used to calculate the estimated FDR. Storey FDR = P(True negative) P(Declare positive | True negative) / P(Declare positive) = P(null hypothesis true) x P-value x N/R Bayes FDR = mean [P(gene belongs to null), for genes declared positive] The Bayesian estimate can be calculated for anyset of genes, not just those based on ranking. This is not possible in approaches relying on ordered p-values. This is illustrated later on the Hedenfalk et al. (2001) breast cancer dataset. The FDR is calculated from the latent variables {z}, integrated over all valuesof k. Simulation Study We have performed 50 simulations of the 2 sets of gene profiles described previously, and calculated the Bayes and Storey estimates of FDR each time. For the Storey method we start with p-values derived from the F-statistics summarizing the gene profiles. The Bayesian mixture fit has support for up to 4 components for Case A and up to 3 for Case B (density plots shown above). In both cases the FDR is well estimated by the Bayesian mixture, with true and estimated Bayes curves following each other closely. The Storey method performs well for the more heterogeneous profiles, but is less good as the overlap between the profiles increases. Multi-class Microarray Experiments Multi-class response experiments are those in which more than two experimental conditions are to be compared. Each gene has repeat measurements under several conditions, forming a gene expression profile. The null hypothesis is no change across conditions (a constant gene profile). Typically there are many different non-constant profiles, leading to more complex alternatives than in two class comparison situations. We have simulated data for 2 sets of profiles for 500 genes, the first with fairly heterogeneous profiles, the second with more homogeneous profiles. Each gene has 8 repeat measurements under 3 conditions. Profiles for 30 genes are shown here. Each line represents one gene. Black lines are genes with no change across conditions, blue and red lines are those with changes. Breast Cancer Data The publicly availablemicroarray dataset from the Hedenfalk et al. (2001)breast cancer study consists of gene-expression data for three classes of tumour, BCRA1-related cancer, BCRA2-related cancer, and sporadic cases of breast cancer. We estimate the Bayesian mixture FDR for pre-defined groups of genes with known functions: apoptosis, cell cycle regulation and cytoskeleton (26, 21 and 25 genes respectively). Transformation of F-statistics The estimated FDR for group of genes involved in cell cycle regulation is considerably smaller than for the other groups, indicating that many of these genes show differences between the different classes of tumour considered here. We summarize each gene profile by an F-statistic. These are transformed to a statistic D which is approximately Gaussian if there is no change across conditions and positively skewed otherwise. Histograms of the D statistics for the simulated data are shown below. The D statistics for the homogeneous profiles are close to those for the Hedenfalk breast cancer data. Predictive densities from the Bayesian mixture model are also shown. References: Storey, J.D. (2001). A direct approach to false discovery rates. JRSS B, 64, 479. Hedenfalk, I. et al. (2001). Gene-expression profiles in hereditary breast cancer. N Engl J Med, 344, 539. Preprint of this work: Broët, P., Lewin, A., Richardson, S., Dalmasso, C. and Magdelenat, H. (2004). A model-based approach for detecting distinctive gene expression profiles in multiclass response microarray experiments. Submitted. Available at http://www.bgx.org.uk Email: a.m.lewin@imperial.ac.uk