Source Identification
Source Identification. Stormwater Work Group March 24, 2010. The Strategy Chapter 2.6.3. Source ID Monitoring is not only monitoring, but the monitoring informs the management action process Source ID is a diagnostic tool with a feedback loop to locate sources, remove, confirm.

Source Identification
E N D
Presentation Transcript
Source Identification Stormwater Work Group March 24, 2010
The Strategy Chapter 2.6.3 • Source ID Monitoring is not only monitoring, but the monitoring informs the management action process • Source ID is a diagnostic tool with a feedback loop to locate sources, remove, confirm
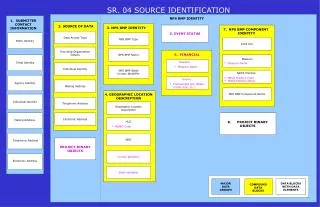
Key Components 1. Evaluate existing data to determine stormwater problem sources/impairments 2. Prioritize Failed Endpoints/Impairments 3. Identify the Stressor 4. Set a Target for Source Reduction 5. Locate the Source(s) 6. Plan and Implement Source Removal Action(s) 7. Establish Follow-up “Monitoring” 8. Incorporate New Monitoring for Prioritization
Existing Information/Data • Prioritize on the WRIA scale • Develop a prioritization method via modeling or scoring (Ecology Watershed Characterization Project is a possibility) based upon resources, beneficial uses. • Info for prioritizing: TMDLs, 303(d), IDDE results, Industrial DMRs, Shellfish Protection Classification, Superfund/MTCA, etc. • There is a trigger to enter the Source ID Loop
Identify the Stressor • This can be a simple process or require research/extensive monitoring • Use EPA Causal Sequence • Biological-Weight of Evidence, Chemical-Work up the system • i.e. Shellfish bed downgrade in rural area, sample up the stream system. Identify farm with 100 stock animals and creek flowing through the pasture. • OR • i.e. B-IBI lower than biological potential, drill down to identify the cause. Aquatic Scientist analyzes peripheral data. Additional monitoring may be needed.
Nature of the Source • Each source will have a different framework for identification, monitoring, removal, and feedback • Copper-optimum control at regulatory level. • Fecal coliform-optimum control at the local level.
Set the Goal • Requires a QAPP or Recovery Plan, or implement existing program • Example: Low B-IBI score, what is the biological potential in that system?
Locate the Source(s) • Performed in the “plan” • Further monitoring, mapping, modeling, etc. may be required to refine the location of the source. • Move “upstream” in the system to refine the location.
Remove the Source(s) • Implement Management Actions, plans, existing programs. • Share successful source removal/reduction programs/activities Puget Sound-wide. • More effective IDDE screening parameters, programs that result in high illicit discharge detection.
Monitoring Requirements • Establish adequate monitoring for feedback • Establish “focused” monitoring to measure progress or determine problem locations • Monitoring will be unique for each stressor identified
Incorporate New Monitoring • S&T programs provide new information of failed endpoints/impairments • Effectiveness programs may provide new information of failed endpoints/impairments Failed Endpoint/Indicator Endpoint Indicator S&T Source ID Process
Hypothesis • Identification, prioritization and removal of stormwater sources result in improved targeted biological endpoints or impairments. • Receiving water S&T monitoring in targeted watersheds results in early source removal program implementation.
Timeline • Prioritization-2012 • Plans-2013 • Begin/continue management actions-2013 • S&T Monitoring Year 1 and 2 results/analysis • 2016-Work on new problem areas identified by S&T or local additional monitoring.
Roles and Responsibilities • Permittees-WRIA Lead, participate in prioritization, lead Source ID projects in their MS4 areas • Industrial and other NPDES Stormwater Permits-DMR data incorporated into prioritization • Ecology-SOPs, Review QAPPs, Plans,
Cost • Dependent on the Source/Stressor. • Many source removal programs are in place, but the monitoring, goals, and feedback loop needs to be implemented and in concert with the identified source.