Download
1 / 3
40 likes | 149 Vues
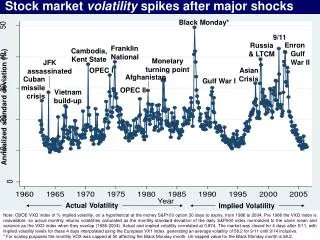
Explore the correlation between actual and implied market volatility after significant events such as Black Monday, 9/11, and Enron collapse. Understand the spikes in stock market volatility post-events like JFK assassination, OPEC crises, and Gulf Wars. Analyze volatility trends from historical crises like Cuban missile crisis, Asian Crisis, and Vietnam build-up. Dive into the monetary turning points and market responses to geopolitical tensions. Discover how the market volatility evolved over time through various financial crises and conflicts. Email nbloom@stanford.edu for detailed historical stock market volatility data from 1802 to 2004.

E N D
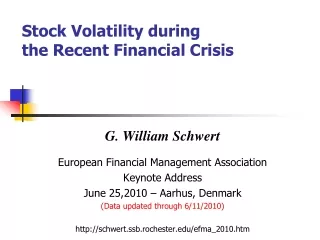
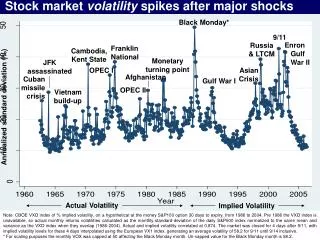
Stock market volatility spikes after major shocks Black Monday* 9/11 Enron Russia & LTCM Franklin National Cambodia,Kent State Gulf War II Monetary turning point JFK assassinated OPEC I Asian Crisis Afghanistan Cuban missile crisis Gulf War I OPEC II Vietnam build-up Annualized standard deviation (%) Actual Volatility Implied Volatility Note: CBOE VXO index of % implied volatility, on a hypothetical at the money S&P100 option 30 days to expiry, from 1986 to 2004. Pre 1986 the VXO index is unavailable, so actual monthly returns volatilities calculated as the monthly standard-deviation of the daily S&P500 index normalized to the same mean and variance as the VXO index when they overlap (1986-2004). Actual and implied volatility correlated at 0.874. The market was closed for 4 days after 9/11, with implied volatility levels for these 4 days interpolated using the European VX1 index, generating an average volatility of 58.2 for 9/11 until 9/14 inclusive. * For scaling purposes the monthly VOX was capped at 50 affecting the Black Monday month. Un-capped value for the Black Monday month is 58.2.
Stock market levels respond very differently September 114 JFK assassinated Russian & LTCMDefault Vietnam Cuban missile crisis Asian Crisis Cambodia, Kent State Monetary cycle turning point WorldCom & Enron OPEC I, Arab-Israeli War Black Monday3 Gulf War II Gulf War I Franklin National financial crisis Afghanistan OPEC II Note: S&P500 monthly index from 1986 to 1962. Real de-trended by deflating by monthly “All urban consumers” price index, converting to logs, removing the time trend, and converting back into levels. The coefficient (s.e.) on years is 0.070 (0.002), implying a real average trend growth rate of 7.0% over the period.
Volatility was very high during the Great Depression The Great Depression Recession of 1937 Banking panic Oil & coal strike Oil & coal strike 9/11 Annualized standard deviation (%) Note: Volatility of the daily returns index from “Indexes of United States Stock Prices from 1802 to 1987” by Schwert (1990). Contains daily stock returns to the Dow Jones composite portfolio from 1885 to 1927, and to the Standard and Poor’s composite portfolio from 1928 to 1962. Figures plots monthly returns volatilities calculated as the monthly standard-deviation of the daily index, with a mean and variance normalisation for comparability following exactly the same procedure as for the volatility data from 1962 to 1985 in figure 1. Contact nbloom@stanford.edu for the data.