Download
1 / 11
160 likes | 462 Vues
Stock Market. By: Priscilla Scott, Brittany Byrd, Matt DeBow. Basic Stock Terms. Technical Analysis- A tool or technique used as a guide to buying and selling stock.

E N D
Stock Market By: Priscilla Scott, Brittany Byrd, Matt DeBow
Basic Stock Terms • Technical Analysis- A tool or technique used as a guide to buying and selling stock. • Derivatives- (also called an underlying security)- derived from another asset. (contract between two or more parties.) Includes: options and futures • Options- a contract between a buyer and seller that gives the buyer the right to buy or sell as asset on or before the expiration time, at an agreed price called the “strike price”.
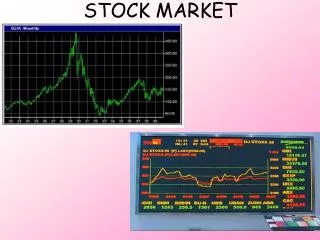
Factors to Consider When Buying or Selling Stock • Volume- The bars shown at the bottom of the chart that show the amount of people invested in that particular stock. • Moving Averages- Shows how stock fluctuates over the time span chosen. • Patterns- Bullish (rising) and Bearish (falling) • Bollinger Bands- Used to measure stocks volatility. (which is stocks tendency to change price) • Stochastic Lines- (Momentum)-over bought or over sold indicators.
Bullish Patterns Double bottom Inverse Head and Shoulders
Bearish Patterns Head and Shoulder Double Top
Popular Chart Patterns • Line- Most basic chart that connects past prices with a line. • Bar-The top notch of the bar is the highest price the stock sold for during the day, the bottom notch of the bar is the lowest price the stock sold for during the day. • Candlestick-Consists of a red and green candles, upper and lower wicks. If the closing price is greater than the opening price the candle will be green, and if the closing price is less than the opening price the candle will be red.
Bar Chart From Stocks4newbies.com
Candlestick Chart From prosticks.com
Risk Assessment • Technical traders use stock charts and patterns to figure out what percentage of the time the pattern, or trend, is correct. (bullish or bearish) • Most traders only use stock patterns that have a high percentage of being right, but of course a stock can go either way, there is always that risk. • Technical analysis helps traders lower their risk by knowing how the stock should trend. • Simulators can also be used, usually for a fee.
Conclusion • Stock are like detective work. You are basically putting together clues (from different charts) to predict the outcomes. Even though we use these clues to predict what will happen in the future of the stock your concerned about, we can never blindly believe that we are correct.