Average Percentage of Uninsured Individuals by State (2010-2012)
This data table presents the average percentage of uninsured individuals across various states in the United States from 2010 to 2012, as reported by the US Census Bureau. It highlights disparities in health insurance coverage, providing insights into states with higher uninsured rates and their implications on public health and policy. This information is crucial for understanding the landscape of health insurance in the U.S. and can inform strategies for increasing coverage. For detailed statistics, refer to the full dataset provided by the Census Bureau.

Average Percentage of Uninsured Individuals by State (2010-2012)
E N D
Presentation Transcript
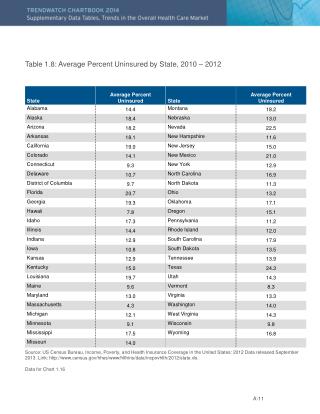
Table 1.8: Average Percent Uninsured by State, 2010 – 2012 Source: US Census Bureau, Income, Poverty, and Health Insurance Coverage in the United States: 2012 Data released September 2013. Link: http://www.census.gov/hhes/www/hlthins/data/incpovhlth/2012/state.xls. Data for Chart 1.16 A-11