Download
1 / 64
640 likes | 825 Vues
Creating contour and ‘heat map’ graphs to display PITCHf/x data. Dave Allen PITCHf/x Summit July 11, 2009. Plotting a value over two variables. We often want to display pitchf/x data over two variables. Examples: Location of pitches in the strike zone. Plotting a value over two variables.

E N D
Creating contour and ‘heat map’ graphs to display PITCHf/x data Dave Allen PITCHf/x Summit July 11, 2009
Plotting a value over two variables We often want to display pitchf/x data over two variables. Examples: • Location of pitches in the strike zone
Plotting a value over two variables We often want to display pitchf/x data over two variables. Examples: • Location of pitches in the strike zone • Home run rate (swing rate, whiff rate, BABIP) by pitch location.
Plotting a value over two variables We often want to display pitchf/x data over two variables. Examples: • Location of pitches in the strike zone • Home run rate (swing rate, whiff rate, BABIP) by pitch location. • Any of those rates by vertical and horizontal movement of a pitch.
Plotting a value over two variables We often want to display pitchf/x data over two variables. Examples: • Location of pitches in the strike zone • Home run rate (swing rate, whiff rate, BABIP) by pitch location. • Any of those rates by vertical and horizontal movement of a pitch. • Speed off the bat by pitch location.
Plotting a value over two variables We often want to display pitchf/x data over two variables. Examples: • Location of pitches in the strike zone • Home run rate (swing rate, whiff rate, BABIP) by pitch location. • Any of those rates by vertical and horizontal movement of a pitch. • Speed off the bat by pitch location. • Vertical angle of the ball off the bat by vertical location and vertical movement of a pitch.
Plotting a value over two variables: Scatter plots Under certain conditions this is possible with a scatter plot.
Plotting a value over two variables: Scatter plots Under certain conditions this is possible with a scatter plot. • When the number of pitches is small.
Plotting a value over two variables: Scatter plots Under certain conditions this is possible with a scatter plot. • When the number of pitches is small. • When they are well clustered.
Plotting a value over two variables: Scatter plots Under certain conditions this is possible with a scatter plot. • When the number of pitches is small. • When they are well clustered. • When they take categorical values.
Plotting a value over two variables: Scatter plots not appropriate When these conditions are not met a scatter plot may not be the best way to display the data.
Plotting a value over two variables: Scatter plots not appropriate When these conditions are not met a scatter plot may not be the best way to display the data. • Too many pitches
Plotting a value over two variables: Scatter plots not appropriate When these conditions are not met a scatter plot may not be the best way to display the data. • Too many pitches • Non-categorical value
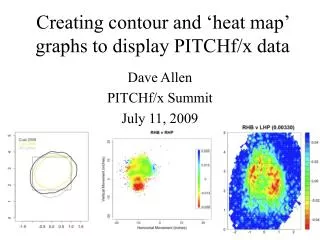
Plotting a value over two variables: Alternative to scatter plots • I suggest in such cases a contour map or ‘heat map’ is a possible alternative.
Plotting a value over two variables: Alternative to scatter plots • I suggest in such cases a contour map or ‘heat map’ is a possible alternative. • These maps do not actually plot the data (pitches), but a surface fit to the data. As if you fit a curve to two dimensional data and then just plot curve, without the points.
Plotting a value over two variables: Alternative to scatter plots • I suggest in such cases a contour map or ‘heat map’ is a possible alternative. • These maps do not actually plot the data (pitches), but a surface fit to the data. As if you fit a curve to two dimensional data and then just plot curve, without the points. • This talk will be broken into two parts: 1) methods of fitting a surface 2) creating the contour map once we have the surface.
Fitting a plane The simplest surface to fit is a plane (analogous to fitting a line).
Fitting a plane mymodel <- lm( hit_v_ang ~ p_z + pfx_z ) The simplest surface to fit is a plane (analogous to fitting a line).
Fitting a plane The simplest surface to fit is a plane (analogous to fitting a line). mymodel <- lm( hit_v_ang ~ p_z + pfx_z ) summary(mymodel)
Fitting a plane The simplest surface to fit is a plane (analogous to fitting a line). mymodel <- lm( hit_v_ang ~ p_z + pfx_z ) summary(mymodel)
Fitting a ‘step’-surface by binning the data • The plane is very limited, especially when looking at values of pitch location because the strike zone presents a ‘non-linearity.’ • A 2d step function provides more flexibility.
Fitting a ‘step’-surface by binning the data • The plane is very limited, especially when looking at values of pitch location because the strike zone presents a ‘non-linearity.’ • A 2d step function provides more flexibility.
Fitting a smoother ‘step’-surface: distance weighted average • Alternatively put a lattice over the area and find the distance weighted average for each point to the lattice. • Creates a smoother surface • With large data sets it can be very computationally intensive
Fitting a surface by LOESS regression • Modern regression method technique that fits a low-degree polynomial to each point in the data set. The polynomial is fit using a weighted least squares, giving more weight to neighboring points nearer the focal point.
Fitting a surface by LOESS regression • Modern regression method technique that fits a low-degree polynomial to each point in the data set. The polynomial is fit using a weighted least squares, giving more weight to neighboring points nearer the focal point. • Very flexible, but quite computationally intense and does not produce a closed form mathematical expression for the fit surface like a fit plane (or polynomial surface would).
Fitting a surface by LOESS regression mymodel <- loess( hr ~ p_x + p_z, span=.75 ) • Modern regression method technique that fits a low-degree polynomial to each point in the data set. The polynomial is fit using a weighted least squares, giving more weight to neighboring points nearer the focal point. • Very flexible, but quite computationally intense and does not produce a closed form mathematical expression for the fit surface like a fit plane (or polynomial surface would).
Fitting a surface by LOESS regression mymodel <- loess( hr ~ p_x + p_z, span=.75 ) • Modern regression method technique that fits a low-degree polynomial to each point in the data set. The polynomial is fit using a weighted least squares, giving more weight to neighboring points nearer the focal point. • Very flexible, but quite computationally intense and does not produce a closed form mathematical expression for the fit surface like a fit plane (or polynomial surface would).
Fitting a surface by LOESS regression alpha = .75 alpha = .25
Displaying the fit surface in R: image mysurface <- read.csv(‘~/Documents/pitchfx_pres/mysurface.csv’, header=FALSE) mysurface <- as.matrix(mysurface)
Displaying the fit surface in R: image mysurface <- read.csv(‘~/Documents/pitchfx_pres/mysurface.csv’, header=FALSE) mysurface <- as.matrix(mysurface) image(x=seq(from=-1.5,to=1.5,length=20), y=seq(from=1,to=3.75,length=25), z=mysurface, col=hsv(h=seq(from=2/3,to=0,length=20),s=1,v=1) )
Displaying the fit surface in R: image mysurface <- read.csv(‘~/Documents/pitchfx_pres/mysurface.csv’, header=FALSE) mysurface <- as.matrix(mysurface) image(x=seq(from=-1.5,to=1.5,length=20), y=seq(from=1,to=3.75,length=25), z=mysurface, col=hsv(h=seq(from=2/3,to=0,length=20),s=1,v=1) )
Displaying the fit surface in R: image mysurface <- read.csv(‘~/Documents/pitchfx_pres/mysurface.csv’, header=FALSE) mysurface <- as.matrix(mysurface) image(x=seq(from=-1.5,to=1.5,length=20), y=seq(from=1,to=3.75,length=25), z=mysurface, col=hsv(h=seq(from=2/3,to=0,length=20),s=1,v=1) ) top <- 3.42 bot <- 1.56 lines(c(-1,-1),c(bot,top)) lines(c(1,1),c(bot,top)) lines(c(-1,1),c(top,top) lines(c(-1,1),c(bot,bot)) #points(…)
Displaying the fit surface in R: image mysurface <- read.csv(‘~/Documents/pitchfx_pres/mysurface.csv’, header=FALSE) mysurface <- as.matrix(mysurface) image(x=seq(from=-1.5,to=1.5,length=20), y=seq(from=1,to=3.75,length=25), z=mysurface, col=hsv(h=seq(from=2/3,to=0,length=20),s=1,v=1) ) top <- 3.42 bot <- 1.56 lines(c(-1,-1),c(bot,top)) lines(c(1,1),c(bot,top)) lines(c(-1,1),c(top,top) lines(c(-1,1),c(bot,bot)) #points(…)
Displaying the fit surface in R: contour mysurface <- read.csv(‘~/Documents/pitchfx_pres/mysurface.csv’, header=FALSE) mysurface <- as.matrix(mysurface)