1. Grunbaum, et al., MMWR/CDC . 2004.
10 likes | 121 Vues
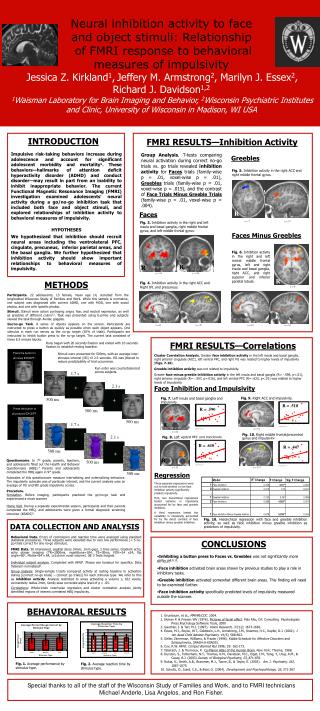
This study explores neural inhibition activity in adolescents using fMRI during a go/no-go task involving face and object stimuli. It examines how activation in areas such as the anterior cingulate cortex (ACC) and insula relates to behavioral measures of impulsivity. The research highlights specific neural responses that indicate a greater level of impulsivity, particularly in response to faces compared to objects, which could inform our understanding of impulsive behaviors linked to disorders like ADHD.

1. Grunbaum, et al., MMWR/CDC . 2004.
E N D
Presentation Transcript
Neural inhibition activity to face and object stimuli: Relationship of FMRI response to behavioral measures of impulsivityJessica Z. Kirkland1,Jeffery M. Armstrong2, Marilyn J. Essex2, Richard J. Davidson1,21Waisman Laboratory for Brain Imaging and Behavior, 2Wisconsin Psychiatric Institutes and Clinic, University of Wisconsin in Madison, WI USA + + Fig. 5. Inhibition activity in the right ACC and right middle frontal gyrus. R z = -7 x = 37 Fig. 3. Inhibition activity in the right and left insula and basal ganglia, right middle frontal gyrus, and left middle frontal gyrus. Fig. 6. Inhibition activity in the right and left rostral middle frontal gyrus, left and right insula and basal ganglia, right ACC, and right superior and inferior parietal lobule. R R y = 14 y = 56 R Fig. 4. Inhibition activity in the right ACC and Right IPL and precuneus. z = 0 x =11 x = 37 x = 33 R = .518 R = .590 Fig. 7. Left insula and basal ganglia and impulsivity. R = .610 Fig. 9. Right ACC and impulsivity. Press the button to all faces EXCEPT: R y = 66 x = 91 Fig. 8. Left ventral PFC and impulsivity. R = .447 1.7 s Fig. 10. Right middle frontal/precentral gyrus and impulsivity. 2.1 s + R y = 24 x = 117 500 ms + 500 ms 1.7 s 500 ms 2.1 s 500 ms Press the button to all pictures EXCEPT: 500 ms 500 ms INTRODUCTION FMRI RESULTS—Inhibition Activity Impulsive risk-taking behaviors increase during adolescence and account for significant adolescent morbidity and mortality1. These behaviors—hallmarks of attention deficit hyperactivity disorder (ADHD) and conduct disorder—may result in part from an inability to inhibit inappropriate behavior. The current Functional Magnetic Resonance Imaging (FMRI) investigation examined adolescents’ neural activity during a go/no-go inhibition task that included both face and object stimuli, and explored relationships of inhibition activity to behavioral measures of impulsivity. HYPOTHESES We hypothesized that inhibition should recruit neural areas including the ventrolateral PFC, cingulate, precuneus, inferior parietal areas, and the basal ganglia. We further hypothesized that inhibition activity should show important relationships to behavioral measures of impulsivity. Group Analysis. T-tests comparing neural activation during correct no-go trials vs. go trials revealed inhibition activity for Faces trials (family-wise p = .01, voxel-wise p = .01), Greebles trials (family-wise p = .01, voxel-wise p = .015), and the contrast of Face Trials Minus Greeble Trials (family-wise p = .01, voxel-wise p = .004). Greebles Faces Faces Minus Greebles METHODS Participants. 22 adolescents, 13 female, mean age 14, recruited from the longitudinal Wisconsin Study of Families and Work. While this sample is normative, one subject was diagnosed with current ADHD, one with MDD, one with social phobia, and one with specific phobia. Stimuli. Stimuli were actors portraying anger, fear, and neutral expression, as well as greebles of different colors2,3. Task was presented using E-prime and subjects viewed the task through Avotec goggles. Go/no-go Task. A series of objects appears on the screen. Participants are instructed to press a button as quickly as possible when each object appears. One stimulus in each run serves as the no-go target (20% of trials). Participants are instructed to inhibit button press to the no-go target. The current task consisted of three 6.5 minute blocks. x = 10 FMRI RESULTS—Correlations Runs began with 20 seconds fixation and ended with 10 seconds fixation to establish resting baseline. Stimuli were presented for 500ms, with an average inter-stimulus interval (ISI) of 2.5 seconds. ISI was jittered to reduce predictability of trial occurrence. Cluster Correlation Analysis. Greater faceinhibition activity in the left insula and basal ganglia, right anterior cingulate (ACC), left ventral PFC, and right M1 was related to higher levels of impulsivity (Figs. 7-10). Greeble inhibition activity was not related to impulsivity. Greater faceminus greebleinhibition activity in the left insula and basal ganglia (R= -.598, p<.01), right anterior cingulate (R= -.507, p=.016), and left ventral PFC (R=-.625, p<.01) was related to higher levels of impulsivity. Run order was counterbalanced across subjects. Face Inhibition and Impulsivity Questionnaire. In 7th grade, parents, teachers, and adolescents filled out the Health and Behavior Questionnaire (HBQ).4 Parents and adolescents completed the HBQ again in 9th grade. Regression Subscales of this questionnaire measure internalizing and externalizing behaviors. The impulsivity subscale was of particular interest, and the current analysis uses an average of 7th and 9th grade impulsivity scores. Procedure. Simulation.Before imaging, participants practiced the go/no-go task and experienced a mock scanner. Home Visit. During a separate experimental session, participants and their parents completed the HBQ, and adolescents were given a formal diagnostic screening interview (KSADS)5. Three separate regressions were run to test whether or not face inhibition activity significantly predicts impulsivity. First, two hierarchical regressions tested variance in impulsivity accounted for by face and greeble inhibition. A third regression tested the variability in impulsivity accounted for by the direct contrast of face inhibition minus greeble inhibition. Fig. 10. Hierarchical regression with face and greeble inhibition activity, as well as face inhibition minus greeble inhibition as predictors of impulsivity. DATA COLLECTION AND ANALYSIS + Behavioral Data. Errors of commission and reaction time were analyzed using standard statistical procedures. Three subjects were excluded due to very low performance (< 5 no-go trials correct for any no-go stimulus). FMRI Data. 30 interleaved, sagittal slices (4mm, 1mm gap), 2 time series. Gradient echo, echo planar imaging (TR=2000ms, repetitions=184, TE=30ms, FOV=24 x24, flip angle=60o, Matrix=64 x 64, 1x1x1mm voxel volume). GE 3 Tesla magnet. Individual subject analysis. Completed with AFNI5. Please see handout for specifics. Data Talairachnormalized6. Group analysis: Single-sample t-tests compared activity at resting baseline to activation during [(correct no-go trials) – (correct go trials)] for each stimulus type. We refer to this as inhibition activity. Analysis restricted to areas activating a volume > 162 voxels, connectivity radius 2mm, family-wise corrected alpha level of p = .05. Correlations: Whole-brain voxel-wise regression and cluster correlation analysis jointly identified regions of interest correlated HBQ impulsivity. CONCLUSIONS • Inhibiting a button press to Faces vs. Greebles was not significantly more difficult8,9,10. • Face inhibition activated brain areas shown by previous studies to play a role in inhibitory tasks. • Greeble inhibition activated somewhat different brain areas. This finding will need to be examined further. • Face inhibition activity specifically predicted levels of impulsivity measured outside the scanner. BEHAVIORAL RESULTS 1. Grunbaum, et al., MMWR/CDC. 2004. 2. Ekman P. & Friesen WV (1976). Pictures of facial affect. Palo Alto, CA: Consulting Psychologists Press.Psychology Software Tools, 2000 3. Gauthier, I. & Tarr, M.J. (1997). Vision Research, 37(12), 1673-1682. 4. Essex, M.J., Boyce, W.T., Goldstein, L.H., Armstrong, J.M., Kraemer, H.C., Kupfer, D.J. (2002). J Am Acad Child Adolesc Psychiatry. 41(5), 588-603. 5. Geller, Zimerman, Williams, & Frazier (1996). Kiddie Schedule for Affective Disorders and Schizophrenia, (WASH-U-KSADS). 6. Cox, R.W. AFNI: Comput Biomed Res 1996; 29: 162-173. 7. Talairach, J. & Tournoux, P. Co-Planar Atlas of the Human Brain. New York: Thieme, 1988. 8. Durston, S., Tottenham, N.T., Thomas, K.M., Davidson, M.C., Eigst, I.M., Yang, Y., Ulug, A.M., & Casey, B.J. (2003).Society of Biological Psychiatry, 53,871-878. 9. Rubia, K., Smith, A.B., Brammer, M.J., Toone, B., & Taylor, E. (2005). Am. J. Psychiatry, 162, 1067-1075. 10. Schultz, D., Izard, C.E., & Bear, G. (2004). Development and Psychopahtology, 16, 371-387. Fig. 1. Average performance by stimulus type. Fig. 2. Average reaction time by stimulus type. Special thanks to all of the staff of the Wisconsin Study of Families and Work, and to FMRI technicians Michael Anderle, Lisa Angelos, and Ron Fisher.