Download
1 / 16
160 likes | 182 Vues
Study on measurement errors in social surveys, methods, advantages, limitations, and reliability estimation strategies using statistical models.

E N D
Estimation of measurement errors in social survey Tho Nguyen Supervisor: Prof. Geert Molenberghs Co-supervisor: Laurent Van Belle
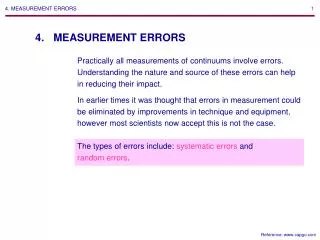
Definition Measurement error is the difference between the value of a characteristic provided by the respondent and the true but unobserved value of that characteristic. (Groves, 1989; Kasprzyk, 2005). Reliability is defined as the proportion of the observed variance from the survey response that is accounted for by the variance of the true score. Faculty of Science - Leuven Statistics Research Centre
Variable classifications Faculty of Science - Leuven Statistics Research Centre
Stable continuous variables The Intraclass correlation coefficient: Main assumption:T1=T2 or T1= c + T2 with c being a constant Advantage: • The theory is simple to understand and communicate • This method is easy to apply Limitation: • The assumption of stable true score is difficult to achieve • The data collection cost can be high, especially for large social surveys Faculty of Science - Leuven Statistics Research Centre
Unstable continuous variables Quasi-Markov simplex model: Advantage: • The simplex model accounts for the instability of true scores • There are different sets of assumptions for different data Limitation: • The data of at least 3 replications (waves) is required • The data must follow the simplex structure and • The assumptions can be restrictive and difficult to achieve Faculty of Science - Leuven Statistics Research Centre
Stable categorical variables Cohen’s Kappa coefficient (Nominal and Dichotomous): • : proportion of the total number of households that have the same response in both replications • the proportion of the households that have the same response by accident For ordinal variables, we can add either a quadratic or linear weight to the calculation of the proportions Advantage: • The Cohen’s Kappa coefficient is simple to apply • This method is widely used and therefore easy to communicate Limitation: • The reliability estimate is biased downward if the class distribution is unbalanced (debatable) • The choice of weighting scheme can be difficult to justify due to its arbitrary nature • Same as ICC ( The stability assumption is difficult to achieve and the data collection cost is high) Faculty of Science - Leuven Statistics Research Centre
Unstable ordinal and dichotomous variablesQuasi-Markov simplex model Continuous Ordinal Quasi-Markov simplex model for categorical variables: • Dichotomous variables: Tetrachoric correlation • Nominal variables: Possible after transforming a nominal variable into multiple dichotomous variables • Ordinal variables: Polychoric correlation Advantage: • Same advantages ad the continuous case Disadvantage: • This method assumes an underlying continuous variable of interest being measured by these categorical variables, which may not be true • Same limitations as the continuous case Comparison of continuous and ordinal measures of continuous latent variables (Alwin, Margins of error, 2007). Faculty of Science - Leuven Statistics Research Centre
Unstable nominal variablesLatent transition model The Latent Markov transition model (LTM) can be used to estimate reliability by analyzing the latent class membership and its transition over time Yule’s Q (Clogg & Manning, 1996): Advantage: • This model also provides the item-response probability of each level of the nominal variables • It can directly estimate the reliability of unstable nominal variables Limitation • This method is difficult to implement • Can only be used to estimate reliability of large samples • The estimate can be biased downward if the class distribution is unbalance Faculty of Science - Leuven Statistics Research Centre
Summary Faculty of Science - Leuven Statistics Research Centre
AppendixMixed model approach to reliability estimation Under a (generalized) linear mixed model, the reliability of a variable can be estimated as the ratio of the variance explained by the model to the total observed variance. Advantage: • The mixed model use “extra information” from the covariates to allows for better separation of measurement error from true variation • Can be used in cases where all of the aforementioned reliability estimation methods fail • The assumptions are more flexible Disadvantage: • It is difficult to construct a theoretically sound model for a variable of interest • Each model is only suitable for a single group of variables, or even a single variable, and need to be changed for different groups/variables. • The mixed model may provide a better reliability estimation, but is difficult to apply, replicate or communicate Faculty of Science - Leuven Statistics Research Centre
AppendixReliability of subpopulations To analyze the effects of other factors on the reliability of a variable: • Identify factors that might affect the reliability of a variable of interest (e.g. gender, language of the interview…). • Separate the sample into subsamples according to the chosen factors • Estimate the reliability of the variable of interest for each subsample, along with its confidence interval • The confidence intervals can be used to test the hypothesis of equal reliabilities The Bonferroni correction can be used to correct for multiple testing Faculty of Science - Leuven Statistics Research Centre