Download
1 / 26
270 likes | 297 Vues
This study by Masataka Taguri and Hisayuki Tsukuma from the University of Tokyo and Toho University presents a novel approach to estimate disease incidence proportions in the presence of measurement errors. The methodology includes regression calibration, proposed estimators, and interval estimation using delta and bootstrap methods. Through numerical examinations, the study evaluates the stability and performance of the estimators and interval estimation techniques. Applications include nutritional studies and exposure variable bias correction. Published references support the methodology and findings.

E N D
Bootstrap Estimation of Disease Incidence Proportion with Measurement Errors Masataka Taguri (Univ. of Tokyo.) Hisayuki Tsukuma (Toho Univ.)
Contents • Motivation • Formulation of the Problem • Regression Calibration Method • Proposed Estimator • Interval Estimation (Delta & Bootstrap) • Numerical Examination
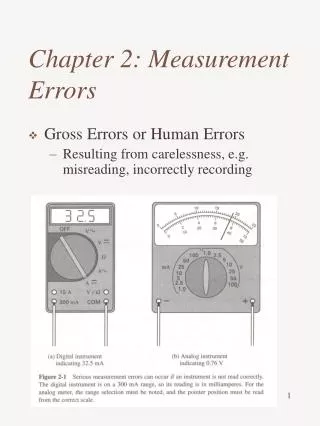
Motivation • Measurementerror problem • The measurement error of exposure variable will tend to give bias estimates of relative risk 〈ex〉 In nutritional studies, FFQ (food frequency questionnaire) is not exact measurement ★ How to obtain correct risk estimates?
Formulation of Problem (1) • Data form • Main data : : binary response (Disease or not) : exposure measured with error : No. of main data-set • Validation data : : true exposure : No. of validation data-set
★ Usual interest : estimation of ( : observable) Formulation of Problem(2) • Disease model • Assume linear relationship of and ~ • Naive model
(i) estimate by maximum likelihood (ii) estimate by ordinary least squares (iii) estimate by Regression Calibration (RC) method • Model ~ Rosner, et al.1989
Asymptotic Variance of • Apply the delta method, then asymptotic variance of is given by
Subject for investigation MLE ★ RC estimator : might be unstable (heavy tailed) ・ : asymptotically ratio of two normal variables OLSE
Objective of our study ① To propose an estimator of • examination of the stability of estimators ② Interval estimation of • Bootstrap Method [Percentile & BCa] • Delta Method ③ Interval estimation of • Bootstrap Method [Percentile & BCa] • Delta Method
Inverse Regression Estimator • To construct alternative estimator of , consider the inverse regression model; • The ordinary least squares estimator of
Generalized Estimator • Ridge-type Estimator for • Generalized Inverse Regression Estimator ★ ⇒ RC estimator ★ The asymptotic distribution of has moments.
Interval Estimation of (by Delta method) [Algorithm] 1) Use and to construct the confidence intervals of 2) Estimate the asymptotic variance of and by delta method 3) Make confidence intervals by normal approximation Rosner, et al.1989
Interval Estimation of (by Bootstrap method) • Estimator : [Algorithm] • Compute by resamples from main data-set. 2) Compute by resamples from validation data-set. 3) Compute for 4) Construct confidence intervals of by Bootstrap Method [Percentile & BCa]. (Efron & Tibshirani, 1993)
Interval Estimation of • Estimator of p : : RC / Inverse Regression Est. • Confidence Interval (C.I.) of p : by Delta or Bootstrap (Percentile & BCa) ★ p should exist between 0 and 1 ⇒ C.I. of logit(p) → C.I. of p
Numerical Examination – Set-up • Validation sample 1°Generate from N(0,1) 2°Assume the model Generate Make validation sample for ★ The above model is a special case of
Main sample 3°Generate Generate from Bernoulli dist.( ). Combine with (paired value of ) ⇒ 4°Set Compute 95% C.I. of logit(p), then p by Normal approximation, Percentile & BCa. ★ Set ・ Computation : for all combination of
Table 1 Estimates of α1(R=1000, B=2000, n=1000, m=100) RC GI
Examination on stability of α1 (1) underestimates except : monotone increasing w.r.t. except for is smaller than for all cases. Biases of , : not so different on the whole. (2) SD, skewness, kurtosis, range : values for > values for ⇒ Tail of distribution is heavier than that of → Outliers may often appear.
Table 2-1 95% Confidence Intervals of α1(R=1000, B=2000, n=1000, m=100) Nor.app. Parcentile BCa
Table 2-2 95% Confidence Intervals of α1(R=1000, B=2000, n=1000, m=100)
Table 2-3 95% Confidence Intervals of α1(R=1000, B=2000, n=1000, m=100)
Examination on confidence interval of α1 (1) Cov. Prob. of NG < Cov. Prob. of NR. Cov. Prob. of normal approximation : monotone decreasing w.r.t. (odds ratio) (2) Length of C.I. by < Length of C.I. by (for all cases) ⇒ stable property of (3) Bootstrap : slightly worse than Normal approxim. (from viewpoint of Cov. Prob.) ★ Percentile is best in case of (4) BCa : not better than other methods ⇔ The distribution of estimates is not so skew?
Table 3-1 95% Confidence Intervals of p(R=1000, B=2000, n=1000, m=100 ; exp(α1)=2.0, λ1=0.5)
Table 3-2 95% Confidence Intervals of p(R=1000, B=2000, n=1000, m=100 ; exp(α1)=2.0, λ1=0.5)
Examination on confidence interval of p • Cov. Prob. for Percentile : does not keep the nominal level, especially in case of Cov. Prob. for BCa : quite satisfactory for almost all cases. (2) Length of C.I. is minimum when T=0. It becomes large rapidly with increase of T. (3) Length for NG is always shorter than that for NR.
References [1] Carroll, R.J., Ruppert, D., Stefanski, L.A.: Measurement Error in Nonlinear Models, Chapman & Hall, New York (1995). [2] Efron, B., Tibshirani, R.J.: An Introduction to the Bootstrap, Chapman & Hall, New York (1993). [3] Rosner, B, Willett, W.C., Spiegelman D.: Correction of logistic regression relative risk estimates and confidence intervals for systematic within-person measurement error, Statistics in Medicine, 8, 1051--1069 (1989).