Download
1 / 21
210 likes | 227 Vues
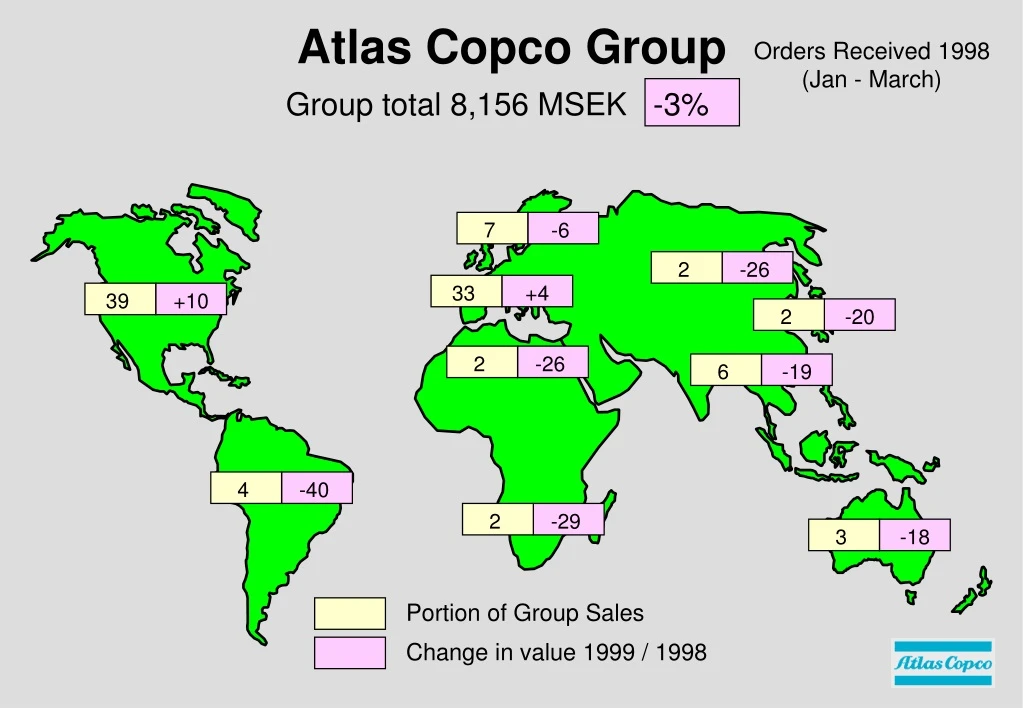
This report provides information on the orders received by Atlas Copco Group from January to March 1998, with a total value of 8,156 MSEK, showing a decrease of 3%. It also includes the change in value of orders and sales from 1998 to 1999, as well as the earnings and profit margins of different business areas within the group.

E N D
AtlasCopco Group Orders Received 1998 (Jan - March) Group total 8,156 MSEK -3% 7 -6 2 -26 33 +4 39 +10 2 -20 2 -26 6 -19 4 -40 2 -29 3 -18 Portion of Group Sales Change in value 1999 / 1998
AtlasCopco Group Jan - March 1998 Jan - March 1999 SEKm Change % Orders Received Orders Invoiced Profit after financial items Profit margin, % 8,404 8,108 881 10.9 8,156 7,751 557 7.2 -3 -4 -37
AtlasCopco Group Earnings by business areas as at March 31 SEKm Margin 1998 1999 1998 1999 Compressor Technique Construction & Mining Industrial Technique Rental Service Corporate items EBIT Financial items Profit after fin. Items Taxes Minority Net profit 607 104 260 97 -25 1,043 -162 881 -313 -7 561 390 84 216 83 -48 725 -168 557 -196 -3 358 17.9 7.0 10.6 11.0 12.9 10.9 6.9 13.1 6.2 8.8 7.7 9.4 7.2 4.6
Compressor Technique AtlasCopco Group Jan - March 1998 Jan - March 1999 SEKm Change % Orders Received Orders Invoiced EBIT EBIT margin, % 3,484 3,384 607 17.9 3,171 2,971 390 13.1 -9 -12 -36
Construction & Mining Technique AtlasCopco Group Jan - March 1998 Jan - March 1999 SEKm Change % Orders Received Orders Invoiced EBIT EBIT margin, % 1,620 1,479 104 7.0 1,445 1,353 84 6.2 -11 -9 -19
Industrial Technique AtlasCopco Group Jan - March 1998 Jan - March 1999 SEKm Change % Orders Received Orders Invoiced EBIT EBIT margin, % 2,497 2,445 260 10.6 2,610 2,448 216 8.8 5 0 -17
Rental Service AtlasCopco Group Jan - March 1998 Jan - March 1999 SEKm Change % Orders Received Orders Invoiced EBIT EBIT margin, % 878 878 97 11.0 1,085 1,082 83 7.7 24 23 -14
AtlasCopco Group Jan - Dec % of NIS Profit after financial items& Profit margin SEKm 11.7 11.6 10.8 10.1 7.2 6.8 7.0 6.0 1987 1989 1991 1993 1997 1999 March 1995
AtlasCopco Group 12 month values Taxes 36.1 36.4 36.3 36.4 34.9 April - March 1995 1996 1997 1998 98/99
AtlasCopco Group SEKm Balance sheet as at March 31 SEKm 1998 % 1999 % SEKm 1998 % 1999 % Intangible ass. Fixed assets Inventories Receivables Other rec. Cash & Bank Total 11,098 9,782 5,602 6,164 1,108 1,781 35,535 31 28 16 17 3 5 11,492 10,803 5,527 6,540 1,130 1,678 37,170 31 29 14 18 3 5 Equity Minority int. Int. bearing liab. & prov. Non int. bear. liab. & prov. Total 13,987 189 11,874 9,485 35,535 39 1 33 27 15,529 201 11,445 9,995 37,170 42 1 31 26
AtlasCopco Group Capital expenditures in tangible fixed assets SEKm 1995 1996 1997 1998 1999 GBS007
AtlasCopco Group 12 month values Inventories & Customer receivablesas percent of sales 19.6 20.2 19.4 19.8 19.6 19.0 17.8 17.4 16.0 16.6 April - March 1995 1996 1997 1998 98/99
AtlasCopco Group Cash and Interest bearing debt as at March SEKm Cash Short-term loans 2,455 1,723 3,306 1,398 2,300 2,657 3,037 2,090 1,781 7,639 1,678 4,654 1,956 1,878 1,987 1,943 5,440 2,221 Long-term loans 1,351 Pensions 2,014 Net borrowings 1,368 2,845 1,660 10,093 9,767 136 1994 1996 1997 1998 1999 1995
AtlasCopco Group Jan - March Cash flow SEKm 1998 1999 Operating cash surplus after tax Of which depreciation added back Change in working capital Cash flow from operations Investments in tangible fixed assets Sale of tangible fixed assets Company acquisitions / divestments Cash flow from investments Net cash flow Change in interest-bearing liabilities Cash flow after financing Liquid funds at year start Translation difference Liquid funds at period end 750 481 -263 -483 305 -147 -325 21 1,613 -15 1,781 487 162 183 748 474 350 -526 186 -126 -466 -1,016 2,118 -56 1,678 1,098 632 -384
AtlasCopco Group Profit per Share quarterly and 12 month values SEK 12:69 11:33 10:64 10:02 7:45 3:40 3:36 3:06 3:28 3:18 2:94 2:87 2:92 2:61 2:64 2:63 2:82 2:23 2:45 2:40 2:17 1:95 1995 1996 1997 1998 1999
AtlasCopco Group April 1999 Industrial and Geographical Demand Outlook Weight by Industry Weight by Region Others 5% Asia/Australia 11% Process 25% Africa/Middle East 5% South America 5% Mining 10% North America 38% Automotive 10% Mechanical 20% Europe 41% Construction 30% Total Demand Outlook
AtlasCopco Group April 1999 Atlas Copco’s “Six Demand Keys” Expendables and After Market 45% Capital Goods 55% Industry Industrial Machine Investment Industrial Production Mining Mining Machine Investment Metal Ore Production Construction Public Investment Construction Activity Total Demand Outlook


