Download

1 / 12
120 likes | 245 Vues
Graphs of Exponential Functions. Choose and interpret the scale of a graph to appropriately represent an exponential function. Learning Goal 2 (HS.N-Q.A.1, 2, 3): The student will be able to use units to solve multi-step contextual problems.

E N D
Graphs of Exponential Functions Choose and interpret the scale of a graph to appropriately represent an exponential function.
Learning Goal 2 (HS.N-Q.A.1, 2, 3): The student will be able to use units to solve multi-step contextual problems.
Sketch a graph that depicts Darryl’s change in elevation over time. • Darryl lives on the third floor of his apartment building. His bike is locked up outside on the ground floor. At 3:00p.m., he leaves to go run errands, but as he is walking down the stairs, he realizes he forget his wallet. • He goes back up the stairs to get it and then leaves again. • As he tries to unlock his bike, he realizes that he forgot his keys. One last time, he goes back up the stairs to get his keys. • Then he unlocks his bike. He is on his way at 3:10pm.
Watch the following Graphing Story… • The video shows bacteria doubling every second. • After watching the video through once, we will go through it slowly. • You will need to make a t-chart showing how many bacteria there are at 0, 1, 2, 3, 4 seconds. https://www.youtube.com/watch?v=gEwzDydciWc
T-chart & Graph Graph the data you have in your t-chart.
Does this describe the bacteria in the video? • At time 0 seconds, there are 2 bacteria, and the number of bacteria in the Petri dish doubles every second. • **This doesn’t describe the EXACT number of bacteria at a given time in the video but it is a reasonable estimate.** • Assignment: • Add to your graph an amount that represents the bacterial population growth beyond the 6-second mark. • What challenges are you running into?
Beyond 6-Seconds • What will the shape of the graph be after the 6-second mark? • Will the curve be perfectly vertical?
REAL Time… • The narrator in the video stated, “Just one bacterium, dividing every 20 minutes…” • If one bacterium divides once every 20 minutes, how much “real time” is passed in what we watched in the time-lapse video? • Re-watch the video: https://www.youtube.com/watch?v=gEwzDydciWc
What “really” happened in the video? • One second of video time equal 20 minutes of real time. • How does this effect our table? • How does this effect our graph? • Make these adjustments to your table and graph. Extend your data for up to five hours (300 minutes).
We could also change the horizontal axis to hours.These units would be more appropriate.
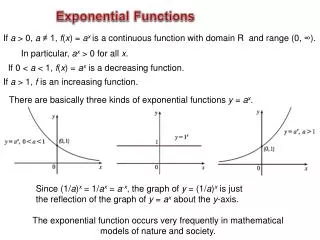
Exponential Function • The graph of the count of bacteria is an example of a graph of an exponential function. • What is the difference between a linear graph and an exponential graph?