Download
1 / 25
250 likes | 420 Vues
Doğu Akdeniz Üniversitesi. Faculty of Business and Economics Department of Banking and Finance. Markets Technical Analysis and Algorithmic Trading Chapter 9 : Relative Strength Analysis. Saeed Ebrahimijam FALL 2013-2014 . FINA417. Contents. Markets Linkage Sectors and Industry Groups

E N D
DoğuAkdenizÜniversitesi Faculty of Business and Economics Department of Banking and Finance Markets Technical Analysis and Algorithmic Trading Chapter 9 : Relative Strength Analysis SaeedEbrahimijam FALL 2013-2014 FINA417
Contents • Markets Linkage • Sectors and Industry Groups • Using Relative Strength between Stocks • Top-Down Analysis • Some evidence from different markets Fundamental of Technical Analysis and Algorithmic Trading
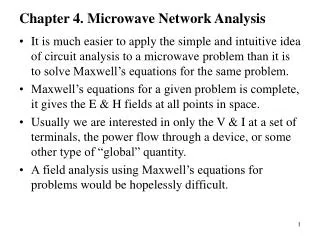
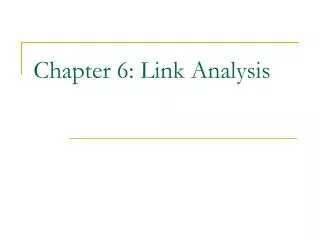
Markets Linkage • Till now our approach to investing has traditionally emphasized a single-market approach. • A stock trader, for example, would study the price charts of the stock market or individual common stocks with little consideration of outside market influences. It was considered sufficient to study the price charts of the market in question along with its own set of internal indicators. The same attitude was true of traders in other asset classes. Bond traders studied bond charts, while commodity traders charted the commodity markets. Currency traders limited their chart work to the currencies they were trading. That is no longer the case. Chart analysis has taken a major evolutionary step over the last decade by emphasizing a more universal intermarket approach. • Some understanding of how the different asset classes interact with each other is important for at least two reasons: • First, such an understanding helps you appreciate how other financial markets influence whichever market you’re interested in. For example, it’s very useful to know how bonds and stocks interact. • If you’re trading stocks, you should be watching bonds. If you’re a bond trader, you should be monitoring the direction of stocks. Very often, chart action in one market will give you a clue about another. For example, a jump in bond prices is often associated with a drop in stock prices. • In another illustration of how one market impacts on another, a falling U.S. dollar is inflationary, which is usually manifested in rising commodity prices. • Gold, for example, is considered to be a leading indicator of inflation. • The technical investor with some knowledge of how the two markets interact with each other (and some knowledge of charting) could have spotted the important trend changes in those two markets and acted accordingly. Fundamental of Technical Analysis and Algorithmic Trading
Bonds and Stock prices relation Fundamental of Technical Analysis and Algorithmic Trading
FALLING DOLLAR PUSHES GOLD TO RECORD HIGH Fundamental of Technical Analysis and Algorithmic Trading
What is RSA? • relative strength analysis and its particular importance in choosing the right sectors and industry groups. - The same holds true for mutual funds themselves. • Relative strength analysis adds an important dimension to market analysis by telling us: how one fund is performing relative to the rest of the market or how it’s performance compares to other fund competitors in the same category. Fundamental of Technical Analysis and Algorithmic Trading
TOP DOWN Analysis Fundamental of Technical Analysis and Algorithmic Trading
Relative strength analysis is an easy concept to understand. • It simply compares the performance of one item (such as a stock) with another item (such as an industry group). • The objective is to determine whether the first item’s price is advancing or declining faster than the second item’s price. In other words, is the first item outperforming or underperforming the second item on a relative basis? • Relative strength analysis is normally used to compare an industry group’s performance to the overall market or a particular stock’s performance toits industry group. • However, it can also be used to compare virtually any two items as long as they have prices (such as two stocks, two commodities, two industry groups, etc.). Fundamental of Technical Analysis and Algorithmic Trading
INDUSTRY GROUP VERSUS A MARKET INDEX • Technicians compare industry groups to the market as a whole using relative strength analysis to determine which industry groups are outperforming or underperforming the overall market. • A ranking of the various industry groups can be made according to their relative strength. • Those industry groups with the highest rankings are candidates for buying; • whereas those with low rankings represent stocks that have the potential for selling or short sales. Fundamental of Technical Analysis and Algorithmic Trading
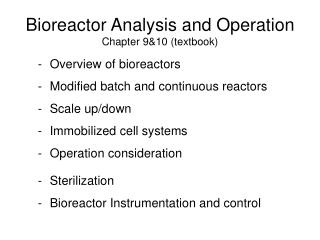
Figure 9-1 compares the electrical equipment industry group to the S&P 500 index. Note that the industry’s relative strength rose throughout most of the time period shown. Therefore, it was outperforming the market. Fundamental of Technical Analysis and Algorithmic Trading
Figure 9-2 demonstrates an industry group (restaurant) with declining relative strength when compared to the S&P 500 index. Thus, it was underperforming the market as a whole for the time period shown. Fundamental of Technical Analysis and Algorithmic Trading
INDIVIDUAL STOCK VERSUS AN INDUSTRY GROUP • In a fashion similar to comparing an industry group to the overall market, a technician can use relative strength analysis to compare an individual stock’s price performance to that of the industry to which it belongs. Fundamental of Technical Analysis and Algorithmic Trading
Measuring Relative Strength methods • Percentage Change Method • Alpha Method • Trend Slope Method • Levy Method Fundamental of Technical Analysis and Algorithmic Trading
THE RELATIVE STRENGTH RATIO • RS line: technical tool that is indispensable for that purpose, the relative strength (RS) line. It’s usually plotted at the bottom of stock charts in newspapers and charting services. How to derive the line? by dividing the price of an individual stock (or a market sector) by market or sector or other asset index. Interpretation: -When the RS line is rising, the stock (or sector) is outperforming the market. -When the RS line is falling, the stock (or sector) is doing worse than the market. - It’s generally better to buy stocks (or sectors) with rising RS lines and avoid those with falling RS lines. Fundamental of Technical Analysis and Algorithmic Trading
A falling dollar since 2002 has helped foreign stocks outperform the U.S. market. A falling dollar favors foreign investments for U.S. investors. Fundamental of Technical Analysis and Algorithmic Trading
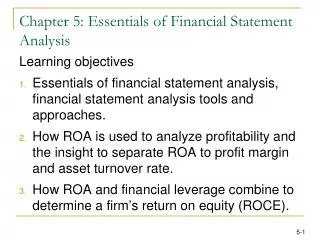
COMPARING GOLD STOCKS TO GOLD Fundamental of Technical Analysis and Algorithmic Trading
The Steps of Technical Analyzing 1- Choosing the appropriate chart and period. 2- Analyzing Market Index Trend 3- Analyzing the top 50 companies in the market Index. ( or industry which the security is between them.) 4- Look at the Price trend for short-term, mid-term, long–term Horizons. 5- Find the Support and Resistance lines and Gaps in the trend. 6- Use technical analysis tools (patterns and indicators) to find the best time to buy or sell. Fundamental of Technical Analysis and Algorithmic Trading
EXAMPLES OF HOW SELECTED PROFESSIONALS SCREEN FOR FAVORABLE STOCKS • The William O'Neil CANSLIM Method • James P. O'Shaughnessy Method • Charles D. Kirkpatrick Method • Value Line Method • Richard D. Wyckoff Method Fundamental of Technical Analysis and Algorithmic Trading