Download
1 / 29
290 likes | 441 Vues
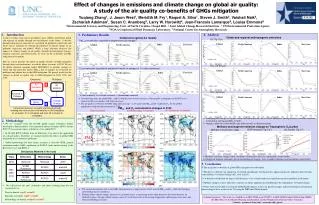
Effect of Global Change on U.S. Air Quality. Murazaki and Hess, JGR 2006 Acknowledgements: L. Emmons, J.F. Lamarque, J. Orlando, G. Tyndall, S. Walters, X.X. Tie N. Mahowald. Effect of Global Change. Import of ozone to the U.S. Ozone produced over the U.S. Repartitioning of NO y budget

E N D
Effect of Global Change on U.S. Air Quality Murazaki and Hess, JGR 2006 Acknowledgements: L. Emmons, J.F. Lamarque, J. Orlando, G. Tyndall, S. Walters, X.X. Tie N. Mahowald
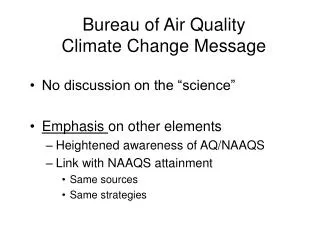
Effect of Global Change • Import of ozone to the U.S. • Ozone produced over the U.S. • Repartitioning of NOy budget • Increased water vapor • Changes in clouds and photolysis rates • Changes in lightning • Changes in meteorology • Planetary Boundary Layer • Synoptic Storms Frequency • Great Plains low-level jet
Methodology • Ran MOZART For Present (1990-2000) and Future Cases (2090-2100) • Winds generated by the CSM forced w/ IPCC A1 scenarios • Emissions fixed at 1990 levels ........................
Simulated O3 Measured O3 Model minus Measurements
Model-Measurement Correlation Figure 3. Correlation of daily maximum 8-hour surface ozone concentrations between model and measurements at EPA AIRS measurement sites in eastern U.S. (squares) and western U.S. (circles) during JJA. The east-west division is assumed to be at 100W.
Future minus Control Surface O3 (JJA) Ozone Change (ppbv) Figure 1.
Ozone Imported Ozone U.S. Ozone +.7% ; +2.8% -11.5% ; -9.7% +5% ; +4.1% Figure 12. As in Figure 4, but for differences in 8 hour maximum ozone concentration (ppbv): (a) ozone (b) contribution of background ozone; (c) contribution from ozone produced from U.S. NOx emissions; (d), (e), and (f) shows the respective differences between the future and control simulations.
What Processes Are Responsible for the Ozone Response? • Temperature Increases • Water Increases
Repartitioning of NOy 6.3 % 4.6 % a) -23.3 % -22.9 % b) Changes in NOx (ppbv) Changes in PAN (ppbv)
Water Vapor Increases • O3 + hv O(1D) + O2 • O(1D) + H2O 2 OH • OH + CO (+ O2 +M) HO2 + CO2(+M) • HO2 + O3 OH + 2O2 LOW NOx HO2 + NO NO2 + OH NO2 + hv -> NO + O O + O2 + M -> O3 + M HIGH NOx
Changes in Clouds (Del Genio and Wolf [2000] show observationally that the low-cloud liquid water path over the Great Plains decreases with increasing temperature due to a decrease in cloud thickness.) -20.7 % -28.1 % +2.8% +4.8% Vertically integrated cloud water Changes in J_O(1D) (g) from the surface to 700hPa.
Changes in Synoptic Frequency Mickley et al., 2004
Changes in Frequency of Synoptic Systems - Confident/Uncertain2-6 day bandpassed frequencies of O3 / CO decrease by 10% / 7.5 %O3 autocorrelation time increases from .13 to .26 at 2 days in future
a) Ozone b) CO Figure 14. Cumulative probability of a) daily maximum 8-hour ozone (ppbv) and b) CO (ppbv).
Ozone Export b) Figure 17. Same as figure 15 except at 70o W.
Figure 11. As in Figure 4, but for the difference in net ozone production (in 105 molec. cm-3 s-1).
c) d) Figure 10. As in Figure 4, but for the differences in (ppbv) (c) OH (pptv) and d) H2O2 (ppbv).
Imported Ozone versus Local Controls From Jacob et al, 1999: Changes in ozone concentrations over the U.S. relative to 1985 values when 25% reduction in anthropogenic NOx and NMHC are implemented with 1985 Asian emissions (left) and 2010 Asian emissions (right).
Changes in Lightning Figure 7. As in Figure 4, but for the difference in vertically integrated lightning NOx production (Tg N yr-1).
% Stratospheric Influence Stratospheric O3 Tracer XNOX Methodology
BACKGROUND OZONE U.S. Summer Our Method Fiore et al, 13-17 LT O3 not produced by U.S NOx emissions O3 produced outside U.S. BL
Mean O3 has increased along the west coast of the U.S. during Spring Jaffe et al., Geophys. Res. Letters, 2003 Marine Boundary Layer Elevated Data Sets Conclusion: Along the U.S. west coast, springtime O3 has increased by ≈ 0.5 ppbv/yr
Difference in days 8-hour O3 > 80 ppbv Figure 13. As in Figure 4, but for the average difference between the future and control simulations of the number of days the 8 hour maximum ozone concentration in a year is greater than 80 ppbv.