Download
1 / 12
130 likes | 356 Vues
Urban air quality modelling (Deliverable 5.2). VITO (Hans Hooyberghs, Nele Veldeman , Bino Maiheu, Lisa Blyth). Overview. Importance of local (urban scale) air quality assessment Urban air quality model chain Results for 1 case study (Shijiazhuang) Spatial pattern

E N D
Urban air quality modelling(Deliverable 5.2) VITO (Hans Hooyberghs, Nele Veldeman, Bino Maiheu, Lisa Blyth)
Overview • Importance of local (urban scale) air quality assessment • Urban air quality model chain • Results for 1 case study (Shijiazhuang) • Spatial pattern • Source attribution and sector contribution • Validation • Outlook
Importance of urban scale modelling Input from Chinese stakeholders • Three VITO-trips to stakeholder 2015 and 2016 • Discussions with national stakeholders • China National Environmental Monitoring Center (CNEMC) • Discussions with local stakeholders • HebeiProvincial Monitoring Center andDongli Environment Monitoring Center • Various local EMCs during meetings in Shijiazhuang and Kunmning • Growing interest in urban scale air pollution modelling • Hot spot detection • Sector contribution (“Which sector causes the pollution?”) • Source apportionment (“Where is the pollution (spatially) coming from?”) • Scenario analysis
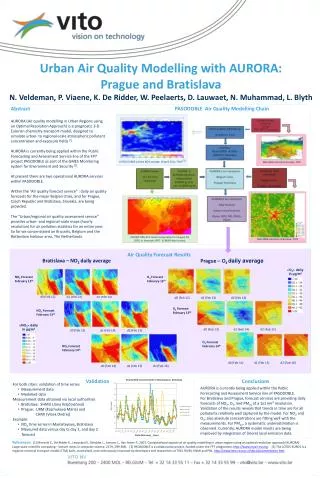
Model chain • Local contribution • Gaussion dispersion modelling (IFDM) • Input data: • Emissions based on MarcoPolo inventory • Line sources: Traffic • Point sources: power plants, large industrial sites • Surface sources: smaller industrial sites, residential • Meteorology: temperature + wind speed Measurement • Background • Originating outside domain + unknown sources in the domain • Coupling with measurements (time series / annual mean). • Mean unexplained fraction = background Background IFDM
Demonstration cases • Pollutants • Nox, PM, BC • Time frame: November 2015 – February 2016 (including several haze episodes) • Demo (!) application for three case studies (chosen based on contact with local partners) Focus on Shijiazhuang
Results Shijiazhuang case study • Hot spot analysis • Resolution of approx. 50m close toroads • Meanconcentrationduring winter period (Nov 2015 – Feb 2016) • Only background consideredfor PM µg/m3 µg/m3 NOx PM2.5
PM Local PM Total NOxLocal • Sector contribution: Which sector is causingthepollution? µg/m3 µg/m3 NOx PM2.5 No background!!! PM Local NOxLocal
Source attribution: where is thepollution (geographically) comingfrom? PM Local PM Total NOxLocal µg/m3 µg/m3 NOx PM2.5 Effect of prevailing wind direction
validation • Measurements of nationalgridand SAILHERO company • 27 stations in total • Correctionforoutages • Only PM2.5 • More scatter in spatialpattern (causedbylocalscale model andits input) • Goodresultsfor time series (causedby background estimate) Bias nationalgrid Street canyon Bad emissions
summary • Urban scale air pollution modelling • Local contribution: Gaussian dispersion • Background estimate: combination with measurements • Case study Shijiazhuang • Hot spot analysis, source attribution and sector contribution • Validation highlights successes and shortcomings (emissions, street canyons…) • Future improvements • Scientific • Betteremissioninventories (bottom-up data) • Street canyons (resuspension) • Couplingto CTM for background estimate • Bridgingthe gap with policy makers • High resolutionforecasting • Scenario analysis
More information: Deliverable 5.2 (draft version, almost final) 谢 谢! Questions?