Download
1 / 24
250 likes | 597 Vues
Overpopulation and Population Control. Miller, G. Tyler (2003) Environmental Science: working with the Earth. Ninth edition. (Chapter 11). What Does Population Density Tell?.

E N D
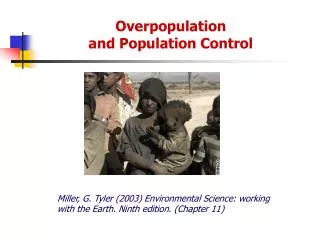
Overpopulation and Population Control Miller, G. Tyler (2003) Environmental Science: working with the Earth. Ninth edition. (Chapter 11)
What Does Population Density Tell? ‘All too often, overpopulation is thought of simply as crowding: too many people in a given area, too high a population density.’ ‘If brute density were the criterion (of overpopulation), one would have to conclude that “Africa is underpopulated”, because it has only 55 people per square mile, while Europe (excluding the USSR) has 261 and Japan 857.”
Distribution of Human Population World Africa
Effective Population Density • If we exclude the desert or impenetrable forest of Africa, the more inhabitable portion is just over ½ of Africa’s area. • Effectivedensity = 117 per sq mile (≃ 1/5 of effective density in UK!) • Even by 2020, Africa’s effective density ⋍ that of France (266 per sq mile), yet few people would consider France is overpopulated.
Overpopulation Occurs When… Overpopulation occurs when the long-term carrying capacity of an area is being degraded by its current human occupants. (**population size of an area relative to the area’s carrying capacity)
Identifying Overpopulation According to World Health Organization (WHO), at present: • 1 billion people: living in poverty • 10 million people: die each year from malnutrition, starvation, and diseases from drinking contaminated water • Premature deaths: 27,400 people per day • Natural resources: under increasing pressure (depleting) Main characteristics of overpopulation in animals: • Mass suffering • A high rate of premature death • Deterioration of the environment Are we overpopulated?
Ecological Footprints Ecological footprint estimates the area of productive land required to • produce the resources used • give room for infrastructure • assimilate the wastes produced (eg carbon dioxide emitted from burning fossil fuels) at a specified material standard of living. We have different ecological footprints We have different impacts on the Earth A useful tool to measure and monitor sustainability.
Global and Local Ecological Footprints • 1997 Ecological Footprint of global population: 2.85; 30% larger than the Earth’s biological productive capacity rapid depletion of resources • 1997 Ecological Footprint of HK: 7.14 (ranked 13th out of 151 countries and regions); • If HK people continued to consume resources and emit carbon dioxide at the same rates would need 444 times the existing land area (or 170 times the total area including marine waters) to sustain ourselves! • If the whole world consumed resources and emitted carbon dioxide at rates similar to HK would need another two planets to support us! ** Stealing the Earth from our future generations! (Data: Living Planet Report 2000, WWF)
Other Implications of Overpopulation • Wealth Gap poverty in developing countries • Uneven distribution of food, medical care, education resources, family planning services
Environmental degradation & pollution per unit of resource used No. of units of resources used per person No. of People Environmental impact of population Environmental Impact of Population Affluence (A) Technology (T) Population size (P) (environmental impact done by the technologies used to supply the resources) Impact (I) I = PAT How can we reduce the environmental impact (I)?
Population Control UN Conference on Population and Development, Cairo 1994(15,000 leaders and representatives from 179 countries): • By 2054: world population stabilized at 7.8 billion • By 2015: everyone on Earth should have • Access to family planning • Primary education for all children 6-11 yrs of age • Increased involvement of men in child-rearing and family planning
United Nations 11 10 9 8 7 6 5 4 3 1990 2050 1950 1970 2010 2030 Population Projections High TFR (2.5) Medium TFR (2.0) Low TFR (1.6)* POPULATION (billions) Current worldwide TFR = 2.8 YEAR *Aim is TFR of 1.6 High Low Medium
Methods for Controlling Growth A government can alter size and growth rate of its population by changing any of the 3 basic demographic variables: • Births • Deaths • Migrations Most developed countries now have relatively low birth and death rates. Most developing countries have relatively low death rates but high birth rates.
Developing countries Developed countries Rate per 1,000 people Year Year Rates of Natural Increase Crude Births and Crude Death Rates
Controlling Migration Only a few countries allow large annual immigration, e.g. Canada, Australia, USA. Some migration is involuntary – involves refugees displaced by: • War • Natural disasters (earthquakes, flooding, drought) • Environmental degradation (desertification, deforestation, resources shortage).
Empowerment of Women Women tend to have fewer and healthier children when: • They have access to education and paid jobs outside the home • They live in societies where they have rights
Controlling Birth Rates Focus of efforts to control population growth: decreasing birth rates Two general approaches: 1. Economic Development may reduce the number of children a couple desires if • They have increased access to education • They have more economic security • They do not need to consider children as old age security 2. Family Planning helps people regulate the number of children they want to have and when
1. Economic Development Demographers studied western European countries that industrialized in the 19th Century. • Developed hypothesis of population change – demographic transition. As countries become industrialized, first their death rates then their birth rates decline. Encourage developing countries make the transition Help to reduce population growth
Stage 4 Post-industrial Stage 1 Pre-industrial Stage 3 Industrial Stage 2 Transitional 40 Birth rate 30 20 Death rate 10 0 Time The Demographic Transition Rates (per 1000 per year) Low Growth Rates ZPG Negative Decreasing Increasing Growth Rates
The Demographic Transition Four distinct stages: • Pre-industrial stage: harsh living conditions • High birth rates to counteract high infant mortalities • Little population growth • Transitional stage: industrialization begins • Death rates drop • Birth rates remain high Rapidpopulation growth • Industrial stage: industrialization widespread • Birth rate drops Growth rate slows • Post-industrial stage: relative high living standard • Birth rates falls further, equaling death rate ZPG; • Then birth rate < death rate Population decreases
40 50 Birth Rate Birth Rate 40 30 30 20 Death Rate Rate (per 1000 of population) 20 Death Rate 10 10 Mexico Sweden 0 0 1800 1750 1950 1970 1850 1900 1895 1920 1945 In transitional stage In postindustrial stage Developed and Developing Countries Population Reference Bureau • Most developing countries: transitional phase. • Most developed countries: industrial stage, a few in post-industrial stage.
2. Family Planning Such programs provide educational and clinical services to help couples (how many children to have and when to have them), including: • Birth control – contraception or sterilization • Birth spacing • Health care for pregnant women and infants Various forms of contraception China has been more successful at slowing population growth than India.
Case Study: China • 1960s: Chinese government realized that without strict population control mass starvation • 1970s: efforts made to slow population growth • 1979: one-child per family policy introduced • Couples: urged to get married late and have only 1 child • Married couples: free access to free sterilization, contraceptives, and abortion • Married couples who pledge to have 1 child: extra food, larger pensions, better housing, free medical care, salary bonuses, free school tuition for the child, etc (couples will be deprived of all benefits if they break the pledge) • 1972 to 2001: TFR 5.7 to 1.8 children per woman Yet, compulsory birth control policy: Controversial!
China’s Future Population China has ~1/5 of world’s population • 11 million people added each year, but only has • 7% of world’s fresh water • 3% of world’s forests • 2% of world’s soils • Greying population – who will take care of the elderly? • Gender imbalance • 117 boys: 100 girls in 2000 Men will outnumber women in China by 60 million!