Download

1 / 9
90 likes | 271 Vues
This study by Colleen Doak from the Department of Nutrition at the University of North Carolina at Chapel Hill examines the nutrition transition in Chinese households, where underweight decreases while overweight increases. Utilizing the International Obesity Task Force BMI references for Chinese children, the research highlights the differences among various household types in terms of urban residence, income, assets, and dietary patterns. The findings revealed significant distinctions between under/overweight households and other types. In comparing under/overweight pairs within households, logistic results were significant at the 0.05 level.

E N D
Colleen Doak Department of Nutrition, University of North Carolina at Chapel Hill, Chapel Hill, NC, USA The Nutrition Transition and the Underweight/Overweight Household in China
Nutrition Transition: Underweight Decreases as Overweight Increases Underweight and under-nutrition Overweight and obesity Nutrition Transition (Carlos Monteiro)
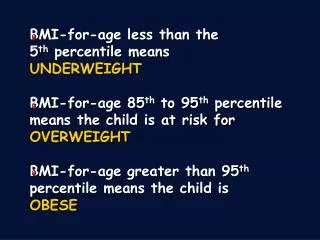
Methods: International Obesity Task Force BMI Reference for Chinese Children 2-18 years old • Overweight: 83% Sensitivity 99% Specificity compared to Must BMI reference, 85th percentile • Underweight: 99% Sensitivity 98% Specificity compared to Must BMI reference, 5th percentile • IOTF is based on the BMI percentile equivalent to adult BMI values for over and underweight
Methods: Household Types % Over Under Normal Under/Over X X X 8.3% 27.6% Underweight X X Overweight X X 26.4% Normal Weight 37.6% X
Under/Over Households Differed from Underweight and Normal Weight Households by Urban Residence, Income, and Assets * Comparing under/over with the other household types, logistic results significant at .005 level
Under/Over Households Differed from Underweight and Normal Weight Households by Diet * Comparing under/over with the other household types, logistic results significant at .05 level
Child 2-10 yrs Adolescent 10-18 yrs Adult 18-40 yrs Adult 18-40 yrs Adult 18-40 yrs Adult 40-60 yrs Child 2-10 yrs Adult 40-60 yrs Methods: Main Pair Combinations Underweight Overweight Percent 14% 23% 8% 17%
Main Pair Combinations Showed Few Significant Differences from Other Under/Over Households *Comparing under/over types with each other, logistic results significant at .05 level