Download

1 / 21
210 likes | 304 Vues
The Physiological Origins of Non-Linearities in the BOLD Response. Douglas C. Noll Alberto L. Vazquez Department of Biomedical Engineering University of Michigan. Outline. Study of Linearity in the BOLD Response Expandable Compartment Model(s) Study of Time-Invariance in the BOLD Response

E N D
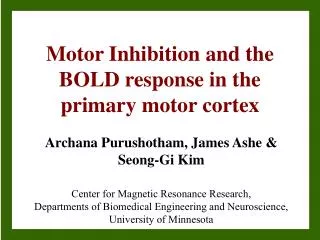
The Physiological Origins ofNon-Linearities in the BOLD Response Douglas C. Noll Alberto L. Vazquez Department of Biomedical Engineering University of Michigan
Outline • Study of Linearity in the BOLD Response • Expandable Compartment Model(s) • Study of Time-Invariance in the BOLD Response • Cascaded Expandable Compartment Model • Comments and Future Work
Fitting of EC Model to Duration Data • Single set of model parameters with different duration stimuli as input • Model parameters derived from 8 s data 2 s 4 s 8 s
EC Model Shows Same Non-linearities • Comparison of 4 superimposed 2 s stimuli to response to 8 s stimulus. • Actual data and model show non-linear effects Superimposed stimuli
Fitting of EC Model to Contrast Data • Single set of model parameters with different blood flow levels as input • Model parameters are from 80% contrast data 10% contrast 80% contrast
EC Model Shows Same Non-linearities • Comparison of two different contrast stimuli normalized to same peak height • Actual data and model show non-linear effects 80% 10%
Time-Variant Behavior of fMRI Response • Linearity (often means additivity of responses) • Time-invariance (a second and necessary condition for the convolution model) • We examined the responses to stimuli with manipulations of: • Time preceding initial stimulus in a series • Time between stimuli
ISI ITI Non-linearity in the Hemodynamic Response • Task • Half visual field alternating checkerboard (8Hz) for a period of 2s • Trial • n-trials = 5 • Inter-stimulus interval = 10s • Inter-trial interval = 90s 2s
Non-linearity of the Hemodynamic Response • Acquisition • General Electric 3.0 Tesla scanner • Single-shot EPI TR = 1000ms TE = 25ms FA = 60deg • Four coronal slices (3mm, skip 0mm)
Responses Differ with Position in Series • Response to the 2nd stimulus is: • Delayed in Rise • Delayed in Peak • Lower in Amplitude • Broader in Time • This example is extreme, but not unique. Response to 1st stimulus Response to 2nd stimulus
Non-linearity in the Hemodynamic Response Delay in ResponseStim. 2 - Stim. 1 EPI Data Activation Response High intensity responses (probably veins)exhibit largest delays
Non-linearity in the Hemodynamic Response • Plot of response delays (stimulus 2 - stimulus 1) vs. percentage signal change • Positive correlation • Larger veins usually have largest responses • These also have longest delays • Implications for modeling the response
Physiologically Relevant Model • Expandable compartment model (balloon) model of Buxton, et al. • Increases in blood volume can account for some non-linear behavior (as well as the fMRI response undershoot) O2 Fin Fout venous capillaries
Cascaded Balloon Model capillaries venous • The original model cannot predict our observed time-variant behavior • Notably, it doesn’t predict a delays for secondary stimuli • New cascaded-compartment model. O2 Fout Fin ... Vn V2 V1
Responses in Different Compartments Compartment 1 Compartment 5 Delay and Shift in Peak No Delay or Shift in Peak
Comparison to Experimental Data Experimental Data Model Predictions Delay in Rise Shift in Peak Cross-over
Aspects of Cascaded Model • The cascaded expandable compartment model will require one additional parameter (3 or 4 + 1). • This additional parameter might be indicative of distance in the vasculature.
Conclusions • The hemodynamic response is quite complex • Physiologically relevant models can predict most of this complex behavior • There are domains in which the response behaves linearly • Linearity greatly eases the analysis and experimental design • The models can help establish if linear models will hold for any given experiment
Conclusions • It is also possible to build the non-linear model directly into the analysis • Parameters might tell not only where activation occurs, but might be used to discriminate between signals from distal and proximal veins
Comments • Why do some find mostly linear behavior? • Many task designs reduce the effects of non-linearity • Most block designs with block longer than 4 s • Event-related designs in the steady state • Event-related designs that do not allow for blood volume changes to return to normal (5 time constants ~ 75 s)
Future Work • Modifications to Buxton’s model (notably the transformation to MR signal parameters) • Study of non-linearities using flow measures • Experimental validation of parts of model