Human Genome Project
250 likes | 419 Vues
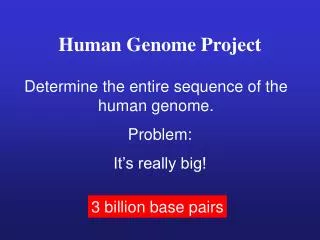
The Human Genome Project (HGP) is a groundbreaking international initiative launched in 1988, with the aim of mapping and sequencing the entire human genome. Funded by the NIH and the U.S. Department of Energy, its primary goals include creating a detailed physical map of human chromosomes, determining the nucleotide sequence of approximately 3 billion base pairs, and identifying all human genes. Advancements in sequencing technologies, such as Sanger and Maxam-Gilbert methods, played a critical role in achieving these goals by 2003, ultimately improving our understanding of human biology and medicine.

Human Genome Project
E N D
Presentation Transcript
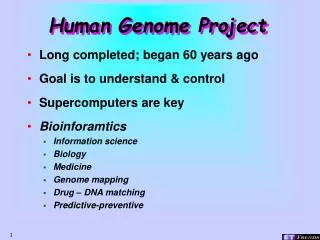
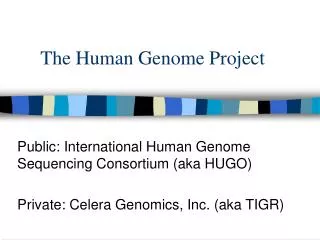
History • 1985. Proposed. 1988. Initiated and funded by NIH and US Dept. of Energy ($3 billion set aside) 1990. Work begins. 1998. Celera announces a 3-year plan to complete the project early Published in Science and Nature in February, 2001 • The quest for genome sequencing was being pursued simultaneously in over 20 laboratories in six countries
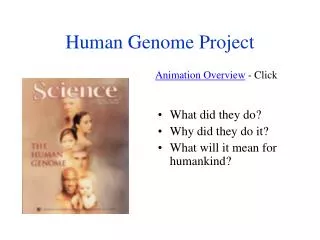
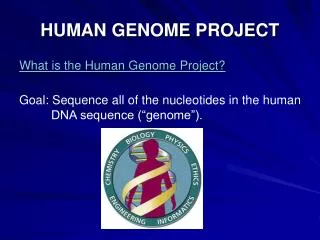
Goals • A primary goal of the Human Genome Project is to make a series of descriptive diagrams—maps—of each human chromosome at increasingly finer resolutions. • After mapping is completed, the next step is to determine the base sequence of each of the ordered DNA fragments. • The ultimate goal of genome research is to find all the genes in the DNA sequence and to develop tools for using this information in the study of human biology and medicine.
Goals • Create physical map of the 24 human chromosomes (22 autosomes, X & Y) • Identify the entire set of genes & map them all to their chromosomes • Determine the nucleotide sequence of the estimated 3 billion base pairs • Analyze genetic variation among humans • Map and sequence the genomes of model organisms
Model organisms • Bacteria (E. coli, influenza, several others) • Yeast (Saccharomyces cerevisiae) • Plant (Arabidopsis thaliana) • Roundworm (Caenorhabditis elegans) • Fruit fly (Drosophila melanogaster) • Mouse (Mus musculus)
DNA from 5 humans 2 males, 3 females Cut up DNA with restriction enzymes Ligated into BACs & YACs, then grew them up Sequenced the BACs Let a supercomputer put the pieces together How they did it…
DNA Cut segments inserted into BACs Lots of overlap Known sequence
Sequencing Technologies • Sequencing procedures currently involve first subcloning DNA fragments from a cosmid or bacteriophage library into special sequencing vectors that carry shorter pieces of the original cosmid fragments. • The next step is to make the subcloned fragments into sets of nested fragments differing in length by one nucleotide, so that the specific base at the end of each successive fragment is detectable after the fragments have been separated by gel electrophoresis.
Sequencing Technologies • The two basic sequencing approaches, Maxam-Gilbert and Sanger, differ primarily in the way the nested DNA fragments are produced. • Maxam-Gilbert sequencing (also called the chemical degradation method) uses chemicalsto cleave DNA at specific bases, resulting in fragments of different lengths. A refinement to the Maxam-Gilbert method known as multiplex sequencing enables investigators to analyze about 40 clones on a single DNA sequencing gel. • Sanger sequencing (also called the chain termination or dideoxy method) involves using an enzymatic procedure to synthesize DNA chains of varying length in four different reactions, stopping the DNA replication at positions occupied by one of the four bases, and then determining the resulting fragment lengths.
Sequencing Technologies • Meeting Human Genome Project sequencing goals by 2003 has required continual improvements in sequencing speed, reliability, and costs. • Previously, standard methods were based on separating DNA fragments by gel electrophoresis, which was extremely labor intensive and expensive. Total sequencing output in the community was about 200 Mb for 1998. In January 2003, the DOE Joint Genome Institute alone sequenced 1.5 billion bases for the month. • Gel-based sequencers use multiple tiny (capillary) tubes to run standard electrophoretic separations. These separations are much faster because the tubes dissipate heat well and allow the use of much higher electric fields to complete sequencing in shorter times.
How the Code was Decoded • DoubleTwist Inc, an application service provider (ASP), devoted to empower life scientists, completed the first annotation of the human genome. • The DoubleTwist human genome database was created using Sun Enterprise 420R and 10 K supercomputers, that is, a total of more than 350 processors. • It brought to a close an extensive analysis of the available HGP data that revealed genes and other valuable information. The task was accomplished using Sun Enterprise supercomputers, including Starfire servers.
Genome Map • A genome map describes the order of genes or other markers and the spacing between them on each chromosome. Human genome maps are constructed on several different scales or levels of resolution. • At the coarsest resolution are genetic linkage maps, which depict the relative chromosomal locations of DNA markers (genes and other identifiable DNA sequences) by their patterns of inheritance. Physical maps describe the chemical characteristics of the DNA molecule itself.
Genetic linkage maps of each chromosome are made by determining how frequently two markers are passed together from parent to child. Because genetic material is sometimes exchanged during the production of sperm and egg cells, groups of traits (or markers) originally together on one chromosome may not be inherited together. Genetic Map
Genetic Map • The value of the genetic map is that an inherited disease can be located on the map by following the inheritance of a DNA marker present in affected individuals (but absent in unaffected individuals), even though the molecular basis of the disease may not yet be understood nor the responsible gene identified.
Physical Maps • Different types of physical maps vary in their degree of resolution. The lowest-resolution physical map is the chromosomal (sometimes called cytogenetic) map, which is based on the distinctive banding patterns observed by light microscopy of stained chromosomes. • A cDNA map shows the locations of expressed DNA regions (exons) on the chromosomal map. • The more detailed cosmid contig map depicts the order of overlapping DNA fragments spanning the genome. • A macrorestriction map describes the order and distance between enzyme cutting (cleavage) sites. • The highest-resolution physical map is the complete elucidation of the DNA base-pair sequence of each chromosome in the human genome. Physical maps are described in greater detail below.
Restriction Enzymes: Microscopic Scalpels • Isolated from various bacteria, restriction enzymes recognize short DNA sequences and cut the DNA molecules at those specific sites. (A natural biological function of these enzymes is to protect bacteria by attacking viral and other foreign DNA.) Some restriction enzymes (rare-cutters) cut the DNA very infrequently, generating a small number of very large fragments (several thousand to a million bp). Most enzymes cut DNA more frequently, thus generating a large number of small fragments (less than a hundred to more than a thousand bp). • On average, restriction enzymes with • 4-base recognition sites will yield pieces 256 bases long, • 6-base recognition sites will yield pieces 4000 bases long, and • 8-base recognition sites will yield pieces 64,000 bases long. Since hundreds of different restriction enzymes have been characterized, DNA canbe cut into many different small fragments.
High-Resolution Physical Mapping • The two current approaches to high-resolution physical mapping are termed “top-down” (producing a macrorestriction map) and “bottom-up” (resulting in a contig map). With either strategy (described below) the maps represent ordered sets of DNA fragments that are generated by cutting genomic DNA with restriction enzymes. • The fragments are then amplified by cloning or by polymerase chain reaction (PCR) methods (see DNA Amplification). Electrophoretic techniques are used to separate the fragments according to size into different bands, which can be visualized by direct DNA staining or by hybridization with DNA probes of interest. The use of purified chromosomes separated either by flow sorting from human cell lines or in hybrid cell lines allows a single chromosome to be mapped
Human genome content • 1-2 % codes for protein products • 24% important for translation • 75% “junk” • Repetitive elements • Satellites (regular, mini-, micro-) • Transposons • Retrotransposons • Parasites
There's a Trap, too • There is concern about the use of genetic information to discriminate against people of a particular race, who are more vulnerable to contracting certain diseases. • It may be used for motives, which can be described as "suspect". It can be, for example, used for slowing the process of ageing or for endowing children with capacities, which today are considered "inhuman". But then, for instance, the nuclear power always had two faces.
References [1]http://marcus.whitman.edu/~hutchidw/Human%20Genome%20Project.ppt [2]http://www.ornl.gov/sci/techresources/Human_Genome/home.shtml [3]http://www.india -today.com/ctoday/20000716/trends.html