Introduction to Absolute Value Expressions and Graphs
60 likes | 267 Vues
Introduction to Absolute Value Expressions and Graphs. Absolute Value. An Official Definition: Practical Definition: Example: Evaluate. Absolute value makes things positive. Read “The absolute value of -7.”. 7. 5. -10. 0. 10. -5. Arithmetic with Absolute Value.

Introduction to Absolute Value Expressions and Graphs
E N D
Presentation Transcript
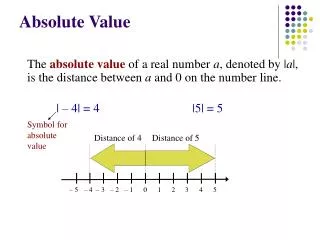
Absolute Value An Official Definition: Practical Definition: Example: Evaluate Absolute value makes things positive. Read “The absolute value of -7.” 7 5 -10 0 10 -5
Arithmetic with Absolute Value In order to evaluate an expression containing an absolute value, the absolute value part needs to be simplified first. Treat the absolute value like parentheses. Example: Evaluate Evaluate the expression inside the absolute value first. Do NOT use the Distributive Property. Absolute value makes things positive. IF you use the awful acronym PEMDAS to evaluate expressions. It can be extended to APEMDAS (evaluate the absolute value expression before parentheses).
Absolute Value in the Calculator The calculator will calculate Absolute Value. Instead of the absolute value bars the calculator uses the abbreviation abs( ). • Hit MATH • Hit the right arrow button for the NUM category • Press enter on 1:abs(
Absolute Value Graph Connect the points. 4 3 2 1 Always make a table. 0 1 All “linear” absolute value graphs will have a “V” shape. 2 3 4
Graphing a 2 Variable Inequality Graphically represent the solutions to the following inequality: Solid or Dashed? Find the Boundary Plot points for the equality Test Every Region Pick a point in each region (0,2) (0,0) Substitute into Original 2 < 1 0 < 1 Shade True Region(s) False True