Absolute Value Functions and Graphs
Learn about absolute value functions, graphing, vertex points, and how to evaluate and graph equations. Practice with examples and complete homework exercises.

Absolute Value Functions and Graphs
E N D
Presentation Transcript
Absolute Value Functions and Graphs Lesson 2-5 2-5 Absolute Value Functions Pg 88
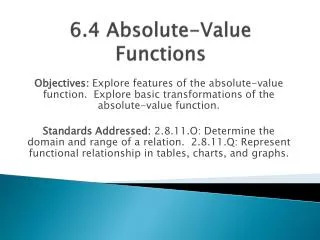
Absolute Value Functions and Graphs Lesson 2-5 Absolute Value Function f(x) = | mx + b | + c where m cannot = 0. f(x) = | 2x – 5 | y = –|x + 3|. Vertex- point where the function reaches a maximum on minimim. The vertex is located at (-b/m, c) Find the vertex above.
Absolute Value Functions and Graphs Graph y = | x |
Make a table of values. x –1.5 –1 –0.5 0 0.5 1 1.5 2 2.5 y 4 3 2 1 0 1 2 3 4 Absolute Value Functions and Graphs Lesson 2-5 Additional Examples Graph y = |2x – 1| by using a table of values. Evaluate the equation for several values of x. Graph the function.
Absolute Value Functions and Graphs Graph y = | 2x – 5|
Absolute Value Functions and Graphs Graph y = - | x + 1 | - 2
Absolute Value Functions and Graphs Lesson 2-5 Additional Examples Graph y = |x – 1| – 1 on a graphing calculator. Use the absolute value key. Graph the equation Y1 = abs(X – 1) – 1
Absolute Value Functions and Graphs Graph y = - | 3x + 4 | in your graphing calculator.
Absolute Value Functions and Graphs Homework Pg 90 2-18 even