
Uploaded by
jered
2 SLIDES
202 VUES
20LIKES
MCI NC
DESCRIPTION
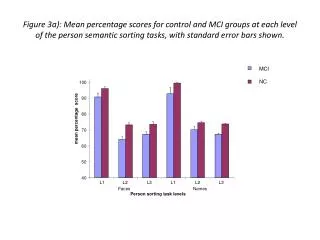
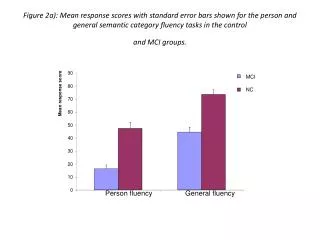
Figure 3a): Mean percentage scores for control and MCI groups at each level of the person semantic sorting tasks, with standard error bars shown. MCI NC.
Download
1 / 2
Télécharger la présentation 
MCI NC
An Image/Link below is provided (as is) to download presentation
Download Policy: Content on the Website is provided to you AS IS for your information and personal use and may not be sold / licensed / shared on other websites without getting consent from its author.
Content is provided to you AS IS for your information and personal use only.
Download presentation by click this link.
While downloading, if for some reason you are not able to download a presentation, the publisher may have deleted the file from their server.
During download, if you can't get a presentation, the file might be deleted by the publisher.
E N D
Presentation Transcript
Figure 3a): Mean percentage scores for control and MCI groups at each level of the person semantic sorting tasks, with standard error bars shown. MCI NC
Figure 3b): Mean percentage scores for control and MCI groups at each level of the general semantic sorting tasks, with standard error bars shown. MCI NC


More Related