Download
1 / 28
290 likes | 495 Vues
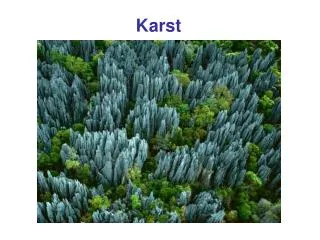
Hydraulic head applications of flowmeter logs in karst aquifer studies. Fred Paillet Geosciences Department University of Arkansas.

E N D
Hydraulic head applications of flowmeter logs in karst aquifer studies Fred Paillet Geosciences Department University of Arkansas
FLOW LOGGINGFlowmeter underpump indicatesflow zones and relative contributionBut estimates oftransmissivity arehighly local and notrepresentative of the flow path
AltonabedrockboreholesExample whereclosely spaced boreholes yieldcompletely different estimatesof T for thesame solutionedbedding planes
Using flow log data to measure hydraulic head • Formulate a two variable inversion • Obtain two flow profiles under different conditions • Usually ambient and pumping • Measure difference in open-hole water level • Model flow using specified T and h values • Vary T and h until match BOTH profiles simultaneously
TWO STEADY FLOW PROFILES USUALLY AMBIENT AND STRESSEDProductive karst – Low Q drawdown same size as head differences so that drawdown is the same order of magnitude as the naturallyoccurring hydraulic head differences, biasing T measurements.
Example where ambient head differences have a major influence on the detection and characterization of flow zones in a karst aquifer. Presence of major flow zones masked by hydraulic head differences.
Ambient flow – no flow tolowest zonePumping flow – no drawdownon middle zone
SUBTRACTION OF INFLOWS METHODRemove head influence by elimination of variable but also throw out any attempt to infer hydraulic head for each flow zoneRef: Molz et al, 1988, WRR
Paillet (WRR, 1998)modelAn alternate approach is to usea flow model to simultaneously fit models to ambient and pumped flow profiles giving directmeasurements of T and h
BOREHOLE FLOW MODELINGYieldsdirect estimates for both T and hMODEL BOTH HEAD AND TRANSMISSIVITYFLOW ZONETRANSMISSIVITYZONE HYDRAULIC HEAD16.8 m 2.0 × 10⁻⁵ m2/s 5.95 m below TC32.0 4.0 × 10⁻⁵ 6.8739.8 1.3 × 10⁻⁵ 6.87
Flow logs in off-line drainage wellsSolution horizons in gypsum rubble aquifer
VERIFICATION OF FLOW MODEL ESTIMATES OF WLPiezometers available in the vicinity of two of the logged drainage wells
Trolling EM FlowmeterHead values indicate an aquitard near 40 m in depth and little vertical head gradient above 40 m
WirelinepackersystemSuitable for use asa standard probe run with other probes during normal wellloggingoperations
Single packer setting – Convert to readings between stationsSite directly above pumped aquifer and had assumed a strong vertical gradient in efforts to monitor heavy metal contamination. Packer data shows lateral drainage by karst bed and negligible downward gradient below 200 feet.
FLOWMETER CROSS-BOREHOLE TESTSMonitor the propagation of drawdown outward along flow paths by measuring the evolving flow regime in an adjacent borehole
Single fracture experiment toverify model predictions where there is a known analytic solution
Ambler PA cross-hole test • Solution on bedding plane connects boreholes • Boreholes 30 m apart • Pumped well – T = 350 m2/day • Observation well – T = 250 m2/day • Pump rate = 23 liters/min • Model response with T = 300 m2/day • Storage coefficient (S) the only variable • Test duration – 1 minute pulse
A more ambitious use of the cross-hole model Leakage between fractures • Two-bedding planes • Pumped well has upper plane cased off • Pump only from lower zone • Measure flow between zones in obsv well • Expect pull down flow from upper to lower
Effect of Leakage on DownflowHead decay time = 1/L in minutes
LEAKY AQUITARD TEST • Two high T karst aquifers • Upper intersects canal • Pump from well completed in lower • Measure borehole flow between aquifers • Is aquitard between them leaky? • If no leakage – pumping induces down flow that steadily increases • If very high leakage flow shows short downward pulse that relaxes over time
Conclusions • T derived from flow logs is highly local • h derived from logs or packers denotes large-scale flow path • Two-variable interpretation can be applied to suitable pairs of flow logs to give T and h • Derive estimates of head on flow paths in open boreholes • Results obtained as part of the routine logging process • Values not as accurate as obtained with packers – but with much less expense and effort • Used as stand-alone data or to prepare for more effective straddle packer program