Download
1 / 66
660 likes | 757 Vues
Reviewing predictions made in 1988 on fisheries changes due to global CO2 increase, recent findings show shifts in fish stocks, ocean conditions, and species composition impacting production. Implications for fisheries management and resource conservation are significant.

E N D
Changes in the fisheries of Atlantic Canada associated with global increases in atmospheric carbon dioxide: a preliminary report (Frank et al. 1988) Review some predictions made 22 years ago, recent findings and implications
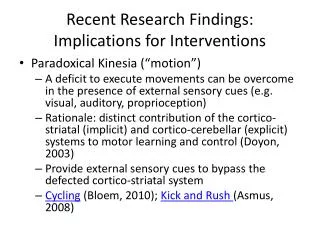
Approach • Scenario developed by Wright et al 1988 of changes in oceanographic conditions from doubling of CO2 • Fishery predictions based on what was known at the time in terms of responses to environmental variability (heavy reliance on published literature)
Productivity • Less frequent episodes of poor recruitment for fish stocks on GB, SS and southern Grand Banks • Reduction in total fish production due to compositional changes in phytoplankton community (diatom to dinoflagellates) and the associated increase in the number of steps in the food chain • Decreased production of the cod stock complex of southern Labrador Shelf, northern Newfoundland and northern Grand Banks – i.e. Northern Cod • Reduction in mean abundance levels of stock whose spawning location are associated with tidally mixed regions
Production declined dramatically as predicted Strong fishing effect More to this story -- Recruitment depends on parent stock Environment can boost or depress -Analysis of residual recruitment Northern Cod Spawning Biomass (‘000 mt)
N. Cod Recruitment Increasingly variable Cold conditions during + NAO reduces survival Warm during -NAO better for survival Residual recruitment + NAO anomaly - 1.0 0.5 0 Parent stock size effect (d.d.) Proportion of total annual recruitment Non-stock size effect (d.i.) High Stock size Low
6 cod stocks combined Cod stocks in 5 out of 6 areas now below this level
Distribution • Northward/shoreward displacement of commercially important groundfish stocks • Expansion of warmer-water species into Canadian waters from localities south of GOM
Average pattern in NW Atlantic • Recent results from Fisher et al 2008. Ecol. Lett. 11:883-897 . • Established pattern was not static • NAO effects large scale pattern of fish diversity (inter-annual) Fish Species Richness Latitude
Northern waters cooler than average + NAO years High latitude; low species richness Mid latitude; medium species richness Southern waters warmer than average Low latitude; high species richness
55°N (Labrador) Number of species 45°N (Nova Scotia) Number of species 35°N (North Carolina) Number of species + NAO years
Northern waters warmer than average - NAO years High latitude; low species richness Mid latitude; medium species richness Southern waters cooler than average Low latitude; high species richness
55°N (Labrador) Number of species 45°N (Nova Scotia) Number of species 35°N (North Carolina) Number of species - NAO years
Expansion into arctic waters Implications of findings Distribution of trans-boundary stocks - NAO + NAO cod, haddock, pollock, yellowtail flounder …
Timing (phenology) • Earlier arrival and later departure times at northern boundaries for species (mainly pelagic) which undergo seasonal migrations; year-round feeding in over-wintering areas is a possibility • Compositional • Changes in fish species composition from groundfish to pelagics due to reduction in flux of organic matter to benthic food web
Changes in Composition of Fishery (landings) Crustaceans Pelagics Major changes in composition – shift from groundfish to pelagics and crustaceans during 1990s – Cod Other groundfish % Newfoundland/ Labrador Crustaceans % Pelagics Conforms to prediction Cod/Other groundfish Eastern Scotian Shelf
All species Plaice Yellowtail Cod Landings (‘000 t) Haddock Halibut Redfish Pollock Groundfish landings from Georges Bank to Newfoundland from 1952 to 1993 Conclusion: Excessive fishing caused declines in groundfish
Cascading food chain effects of over-fishing Nfld ESS GB
Response to fishing depends on geographic location (food chain and target species) • Particularly important in Canadian Atlantic where strong gradients in water temperature exist
Probability of target species being replaced by other functional similar species is greater in warmer water/species rich areas Food chain remains balanced – no cascading effects Aggregate biomass Target species Top predator level Time
20 cod populations in N. Atlantic • Warmer waters accelerate growth 3 1 2 5 6 4 Population growth rate 7 9 Age at maturity 8 • and maturation rates 4 7 6 8 5 9 1 2 3 Water temperature Water temperature Target species able to sustain higher exploitation Myers et al. 1997
Avg. bottom temperature range among strata: 2-10° C Rate of change in cod biomass (1970-2008) Assume uniform impact of fishing across strata Local Temperature effects on Cod R2 = 0.60 Eastern Scotian Shelf West East
Conclusions • Many of the predictions came true but for wrong reasons • Results of recent research have major implications for fisheries management and resource conservation • Water Temperatures Matter! (both absolute level and variability) and knowledge of driving forces critical The End
Red = higher avg. abundance during –NAO years Green = higher avg. abundance during +NAO years
In North Atlantic, pattern of trophic forcing related to temperature and species richness western areas eastern areas All areas heavily exploited yet species rich and warmer water areas remain bottom-up from Frank et al 2006 TREE
Increasing range with latitude 40 45 50 55o N
Aggregate abundance of top predators is maintained by alternate species in species rich areas, despite depletion of target species • Predator versus prey correlation remains positive ++ • Balance between predators and prey Aggregate biomass Target species Top predator level Time
Demographic rates of cod influenced by water temperature Low Medium High Targeted species inhabiting warmer waters more resilient to exploitation effects (Myers et al. 1997)
What do we really know about climate effects on fisheries in the NW Atlantic? (no confounding with fisheries effects) • Influence of NAO • Tile fish kill of 1882 • Inter-annual variation in fish species richness
Summary • Trophic structure of warmer water, species rich systems appears resilient to exploitation effects; conversely, structure of colder water systems much less resilient • Expect fishing effects to be reversible on target species in warmer water systems, but concern for rapid re-direction of fishing effort on compensating species • Fishing effects not easily reversed in colder water systems and large marine ecosystems are not immune to trophic cascades
Water temperatures warmer in south; gradients stronger in western areas Warmer water promotes faster growth rates and greater capacity of target species to withstand exploitation
Functional correlates of body size • When community is composed of larger individuals/species • Lifespan -- longer • Natural mortality -- lower • Age of maturity -- later • Number of offspring -- higher • Time to starvation (endurance) -- longer • Range size – broader • Prey size – larger • Also unit price higher
In an undisturbed system: K-selected species can survive quite well (e.g large piscivorous species) In heavily exploited systems: r-selected species are favoured
ERI stuff • In recent past we have demonstrated • Strength of latitudinal gradient in fish diversity (Labrador to Cape Hatteras) varies in relation to NAO forcing • Stability of exploited ecosystems dependent on temperature and species richness • Relative importance of trophic vs environmental effects in structuring marine food chains • To what extent are contemporary populations of fish responsive to environmental variability • When we speak of fish we mean cod
Cod is the fisheries biologists equivalent of “Calanus” in terms of ubiquity in the North Atlantic and its focus for the study of climate change effects Unlike Calanus, Cod is heavily exploited by humans and has been for decades
Over exploitation typically results in loss of largest individuals, decrease in mean age and number of reproductive age groups, reduction in spawning biomass • Such changes imply loss of capacity to buffer against environmental variability • Expect: • variance in R (recruitment) to increase • Stronger link between environment and R Impact on Recruitment Annual time scale Space scale
1 2 3 6 4 5
4- 4X 5- 5Z 6- 5Y 1- 2J3KL 2- 3NO 3- 4VsW Since late 1990s 20-35% (4X,5Z); 50-100% 5Y Since late 1990s all < 5 %
Residual R – number of new recruits independent of abundance of spawning stock 4X 5Z 5Y 2J3KL 3NO 4VsW Amplitude of residual variation increases as spawning stock declines
Water temperature Fish Species Richness Probability of target species being replaced by other functional similar species is greater in warmer water/species rich areas Food chain remains balanced – no cascading effects
Increase in residual recruitment variance Could be linked to climate variability One approach adopted follows that of Ottersen et al 2006
December–March sea temperature 0–200 m and cod year-class strength from 1943–1999 Moving correlations used to describe temporal development of sea temperature – cod recruitment relationship Results --